Top 21 Lubricants Companies, Worldwide 2023
Table of Contents
1 Introduction
1.1 Market Definition
2 Market Overview
2.1 Introduction
2.2 Market Dynamics
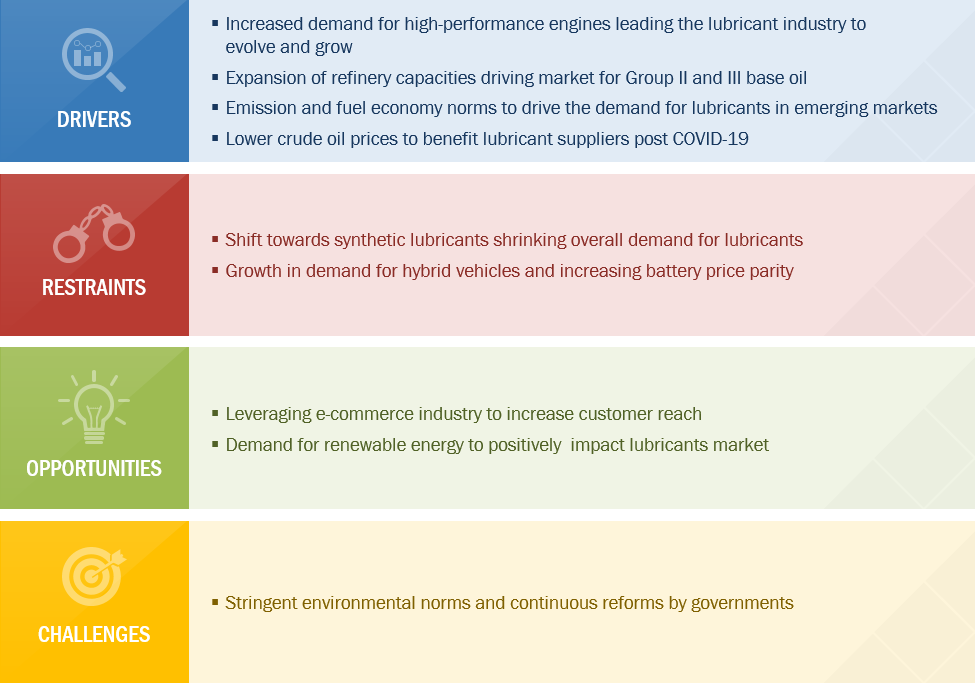
Figure 1 Factors Governing the Lubricants Market
2.2.1 Drivers
2.2.1.1 Increased Demand for High-Performance Engines Leading the Lubricants Industry to Evolve and Grow
2.2.1.2 Expansion of Refinery Capacities Driving the Market for Group II and Group III Base Oil
2.2.1.3 Emission and Fuel Economy Norms to Drive Demand for Lubricants in Emerging Markets After Covid-19
Table 1 Implementation Emission Standards for Light-Duty Vehicles in China
2.2.1.4 Lower Crude Oil Prices Will Benefit Lubricants Suppliers After Covid-19
Table 2 Crude Oil Price Forecast
2.2.2 Restraints
2.2.2.1 Shift Toward Synthetic Lubricants Causing Shrink in the Overall Demand for Lubricants
2.2.2.2 Growth in Demand for Hybrid Vehicles and Increasing Battery Price Parity
2.2.3 Opportunities
2.2.3.1 Leveraging E-Commerce Industry to Increase Customer Reach
2.2.3.2 Demand for Renewable Energy to Positively Impact the Lubricants Market
2.2.4 Challenges
2.2.4.1 Stringent Environmental Norms and Continuous Reforms By Governments
2.3 Impact of Covid-19 on Lubricants Market
2.3.1 Disruption in Automotive Industry
2.3.1.1 Impact on Customers’ Output & Strategies to Resume/Improve Production
Table 3 Automotive Companies’ Announcements
2.3.1.2 Customer’s Most Impacted Regions
2.3.1.3 Risk Assessment and Opportunities
Table 4 Opportunity Assessment in Automotive Industry – Short Term Strategies to Manage Cost Structure and Supply Chain
2.3.1.4 Growth Outlook and New Market Opportunities
2.3.2 Disruption in Metal & Mining Industry
2.3.2.1 Impact on Customers’ Output & Strategies to Resume/Improve Production
Table 5 Mining Companies’ Announcements
2.3.2.2 Customer’s Most Impacted Regions
2.3.2.3 Risk Assessment and Opportunities
Table 6 Opportunity Assessment in Mining Industry – Short Term Strategies to Manage Cost Structure and Supply Chain
2.3.2.4 Growth Outlook and New Market Opportunities
2.3.3 Disruption in Construction Industry
2.3.3.1 Impact on Customers’ Output & Strategies to Resume/Improve Production
Table 7 Construction Companies’ Announcements
2.3.3.2 Customer’s Most Impacted Regions
2.3.3.3 Growth Outlook and New Market Opportunities
2.3.4 Disruption in Oil & Gas Industry
2.3.4.1 Impact on Customers’ Output & Strategies to Resume/Improve Production
Table 8 Oil & Gas Companies’ Announcements
2.3.4.2 Customer’s Most Impacted Regions
Table 9 Opportunity Assessment in Oil & Gas Industry – Short Term Strategies to Manage Cost Structure and Supply Chain
2.3.4.3 Growth Outlook and New Market Opportunities
3 Company Evaluation Quadrant
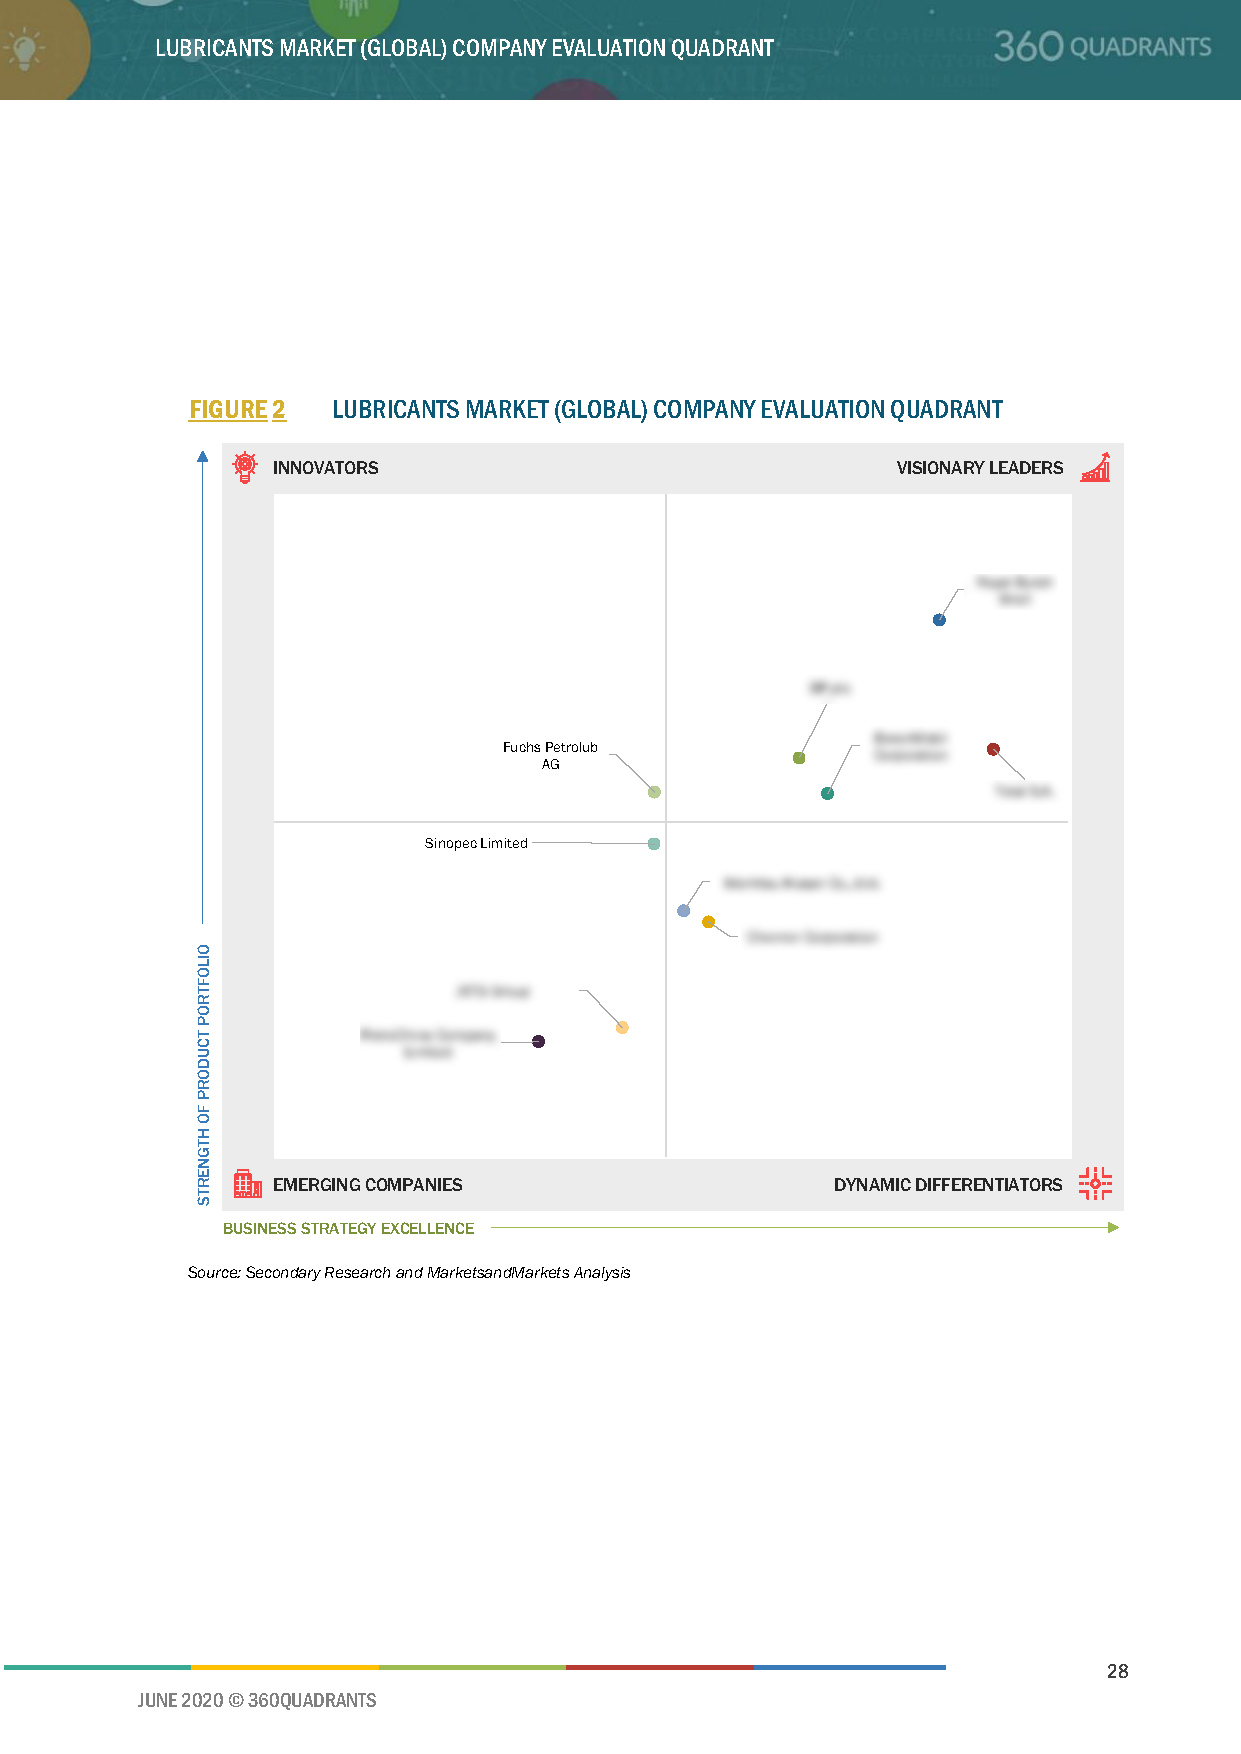
3.1 Visionary Leaders
3.2 Dynamic Differentiators
3.3 Innovators
3.4 Emerging Companies
Figure 2 Lubricants Market (Global) Company Evaluation Quadrant
3.5 Strength of Product Portfolio
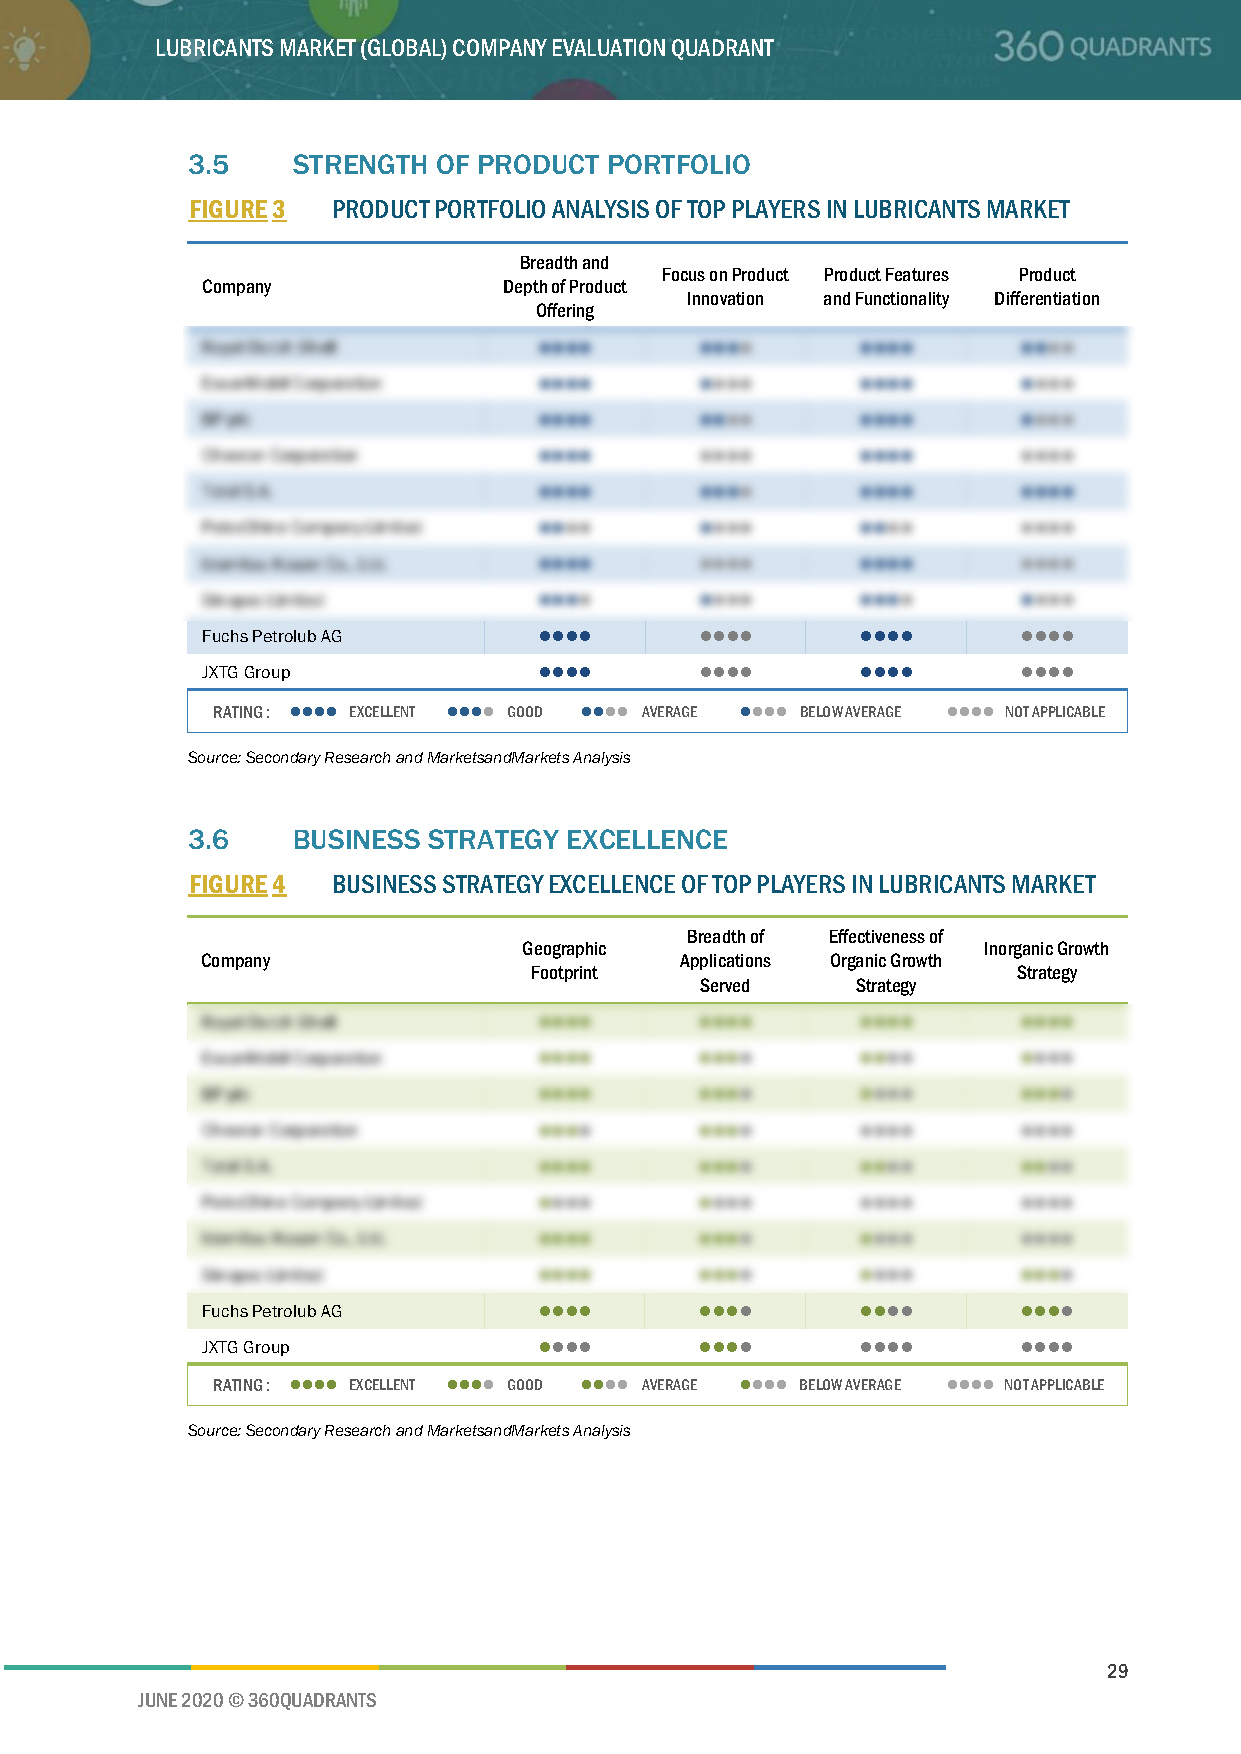
Figure 3 Product Portfolio Analysis of Top Players in Lubricants Market
3.6 Business Strategy Excellence
Figure 4 Business Strategy Excellence of Top Players in Lubricants Market
4 Company Evaluation Quadrant – SME’s
4.1 Progressive Companies
4.2 Responsive Companies
Figure 5 Lubricants Market Company Evaluation Quadrant (SME’s)
4.3 Strength of Product Portfolio
Figure 6 Product Portfolio Analysis of Top Players in Lubricants Market
4.4 Business Strategy Excellence
Figure 7 Business Strategy Excellence of Top Players in Lubricants Market
5 Competitive Landscape
5.1 Overview
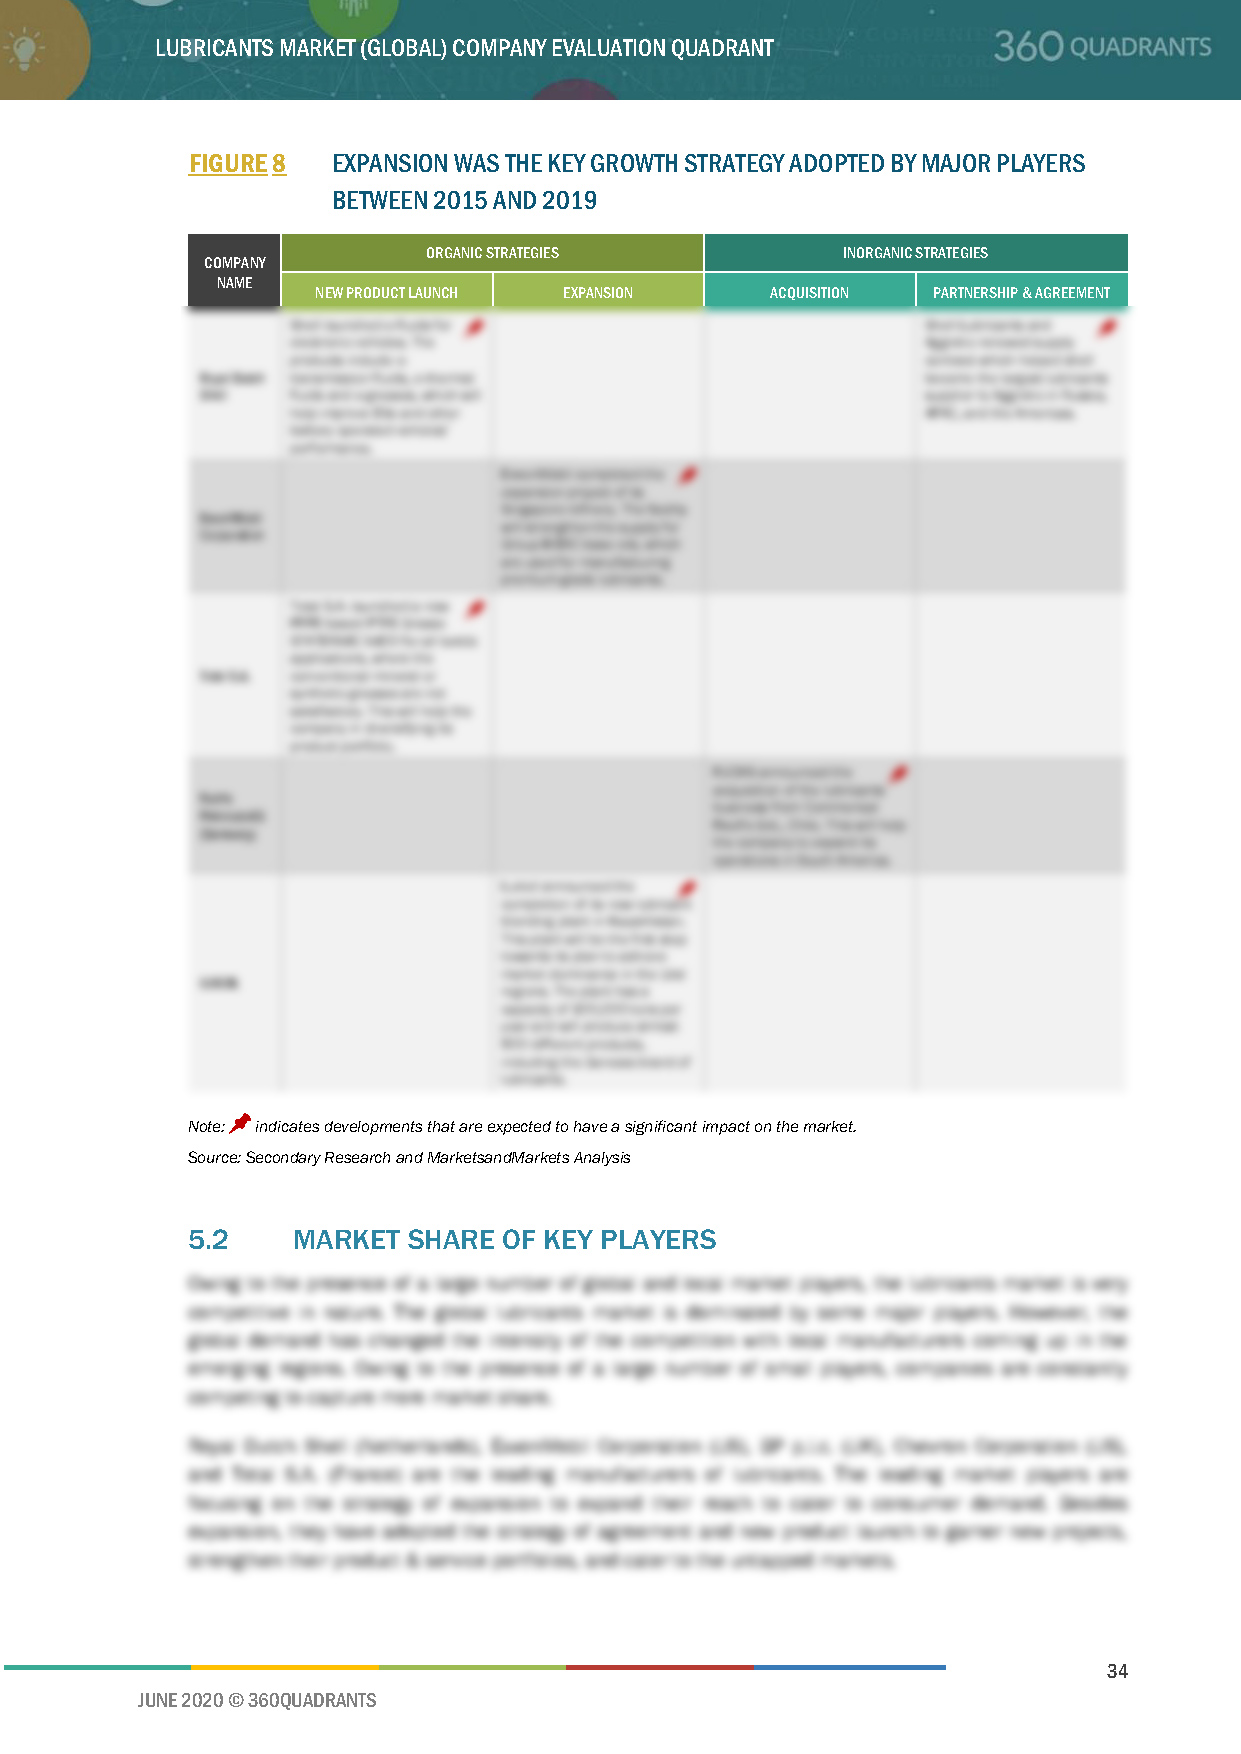
Figure 8 Expansion Was the Key Growth Strategy Adopted By Major Players Between 2015 and 2019
5.2 Market Share of Key Players
Figure 9 Lubricants Market Share, By Company, 2019
5.2.1 Royal Dutch Shell
5.2.2 Exxonmobil Corporation
5.2.3 BP P.L.C.
5.3 Competitive Situation and Trends
5.3.1 Expansion
Table 10 Expansion, 2015–2019
5.3.2 Contract & Agreement
Table 11 Contract & Agreement, 2017–2019
5.3.3 Acquisition
Table 12 Acquisition, 2018–2019
5.3.4 Joint Venture
Table 13 Joint Venture, 2016
5.3.5 New Product Launch
Table 14 New Product Launch, 2018–2019
6 Company Profiles
6.1 Royal Dutch Shell
6.1.1 Business Overview*
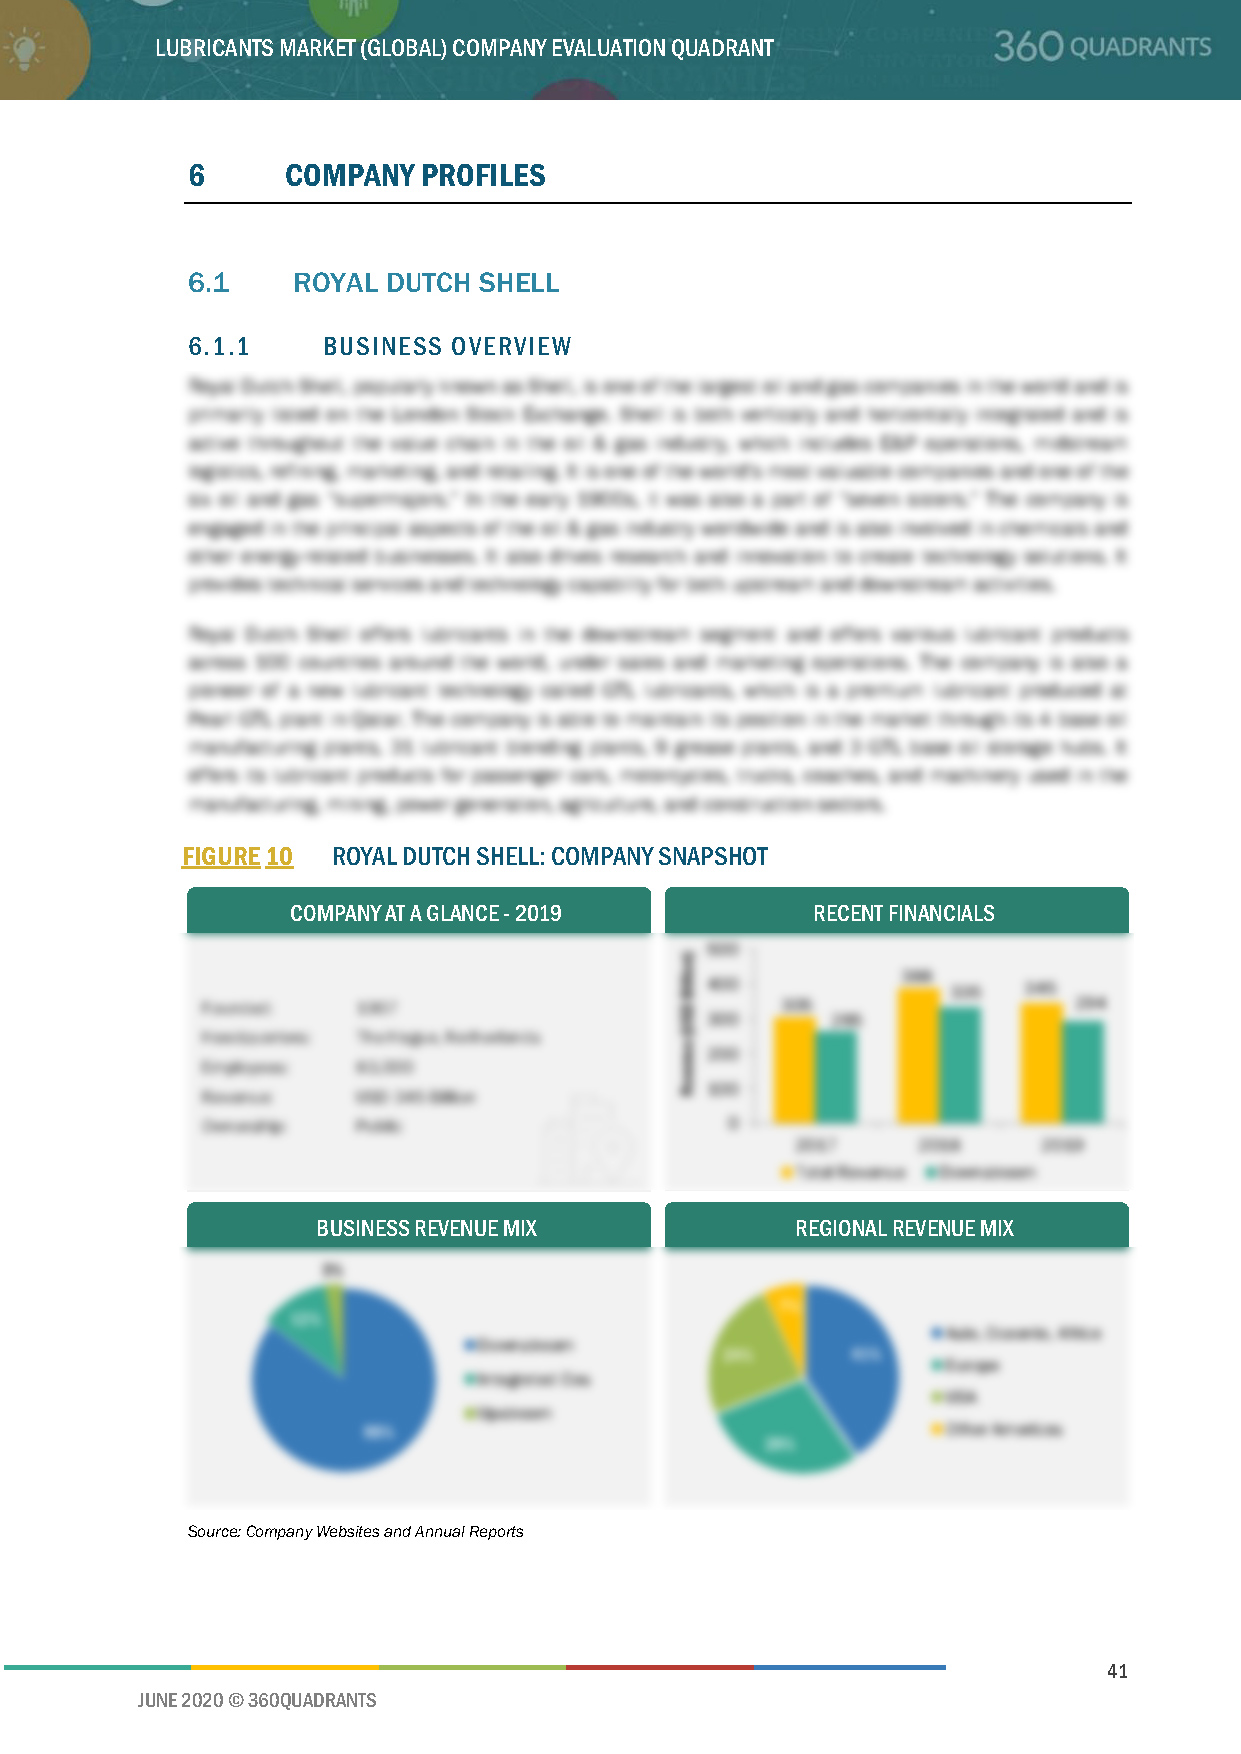
Figure 10 Royal Dutch Shell: Company Snapshot
6.1.2 Products Offered*
6.1.3 Recent Developments*
6.1.4 Winning Imperatives*
Figure 11 Royal Dutch Shell: Winning Imperatives
6.1.5 Current Focus and Strategies*
6.1.6 Threat From Competition*
6.1.7 Right to Win*
(*Above sections are present for all of below companies)
6.2 Exxonmobil Corporation
Figure 12 Exxonmobil Corporation: Company Snapshot
Figure 13 Exxonmobil Corporation: Winning Imperatives
6.3 BP P.L.C.
Figure 14 BP P.L.C.: Company Snapshot
Figure 15 BP P.L.C.: Winning Imperatives
6.4 Chevron Corporation
Figure 16 Chevron Corporation: Company Snapshot
Figure 17 Chevron Corporation: Winning Imperatives
6.5 Total S.A.
Figure 18 Total S.A.: Company Snapshot
Figure 19 Total S.A.: Winning Imperatives
6.6 PetroChina Company Limited
Figure 20 PetroChina Company Limited: Company Snapshot
6.7 Idemitsu Kosan Co. Ltd.
Figure 21 Idemitsu Kosan Co. Ltd.: Company Snapshot
6.8 Sinopec Limited
Figure 22 Sinopec Limited: Company Snapshot
6.9 Fuchs Petrolub AG
Figure 23 Fuchs Petrolub AG: Company Snapshot
6.10 JXTG Group
Figure 24 JXTG Group Petrolub AG: Company Snapshot
6.11 Valvoline
Figure 25 Valvoline: Company Snapshot
6.12 LUKOIL
Figure 26 LUKOIL: Company Snapshot
6.13 PETRONAS
Figure 27 PETRONAS: Company Snapshot
6.14 Pertamina
Figure 28 Pertamina: Company Snapshot
6.15 Gazprom Neft
Figure 29 Gazprom Neft: Company Snapshot
6.16 Indian Oil Corporation Limited
Figure 30 Indian Oil Corporation Limited: Company Snapshot
6.17 Phillips 66
Figure 31 Phillips 66: Company Snapshot
6.18 Hindustan Petroleum Corporation Limited (HPCL)
Figure 32 Hindustan Petroleum Corporation Limited: Company Snapshot
6.19 Petrobras
Figure 33 Petrobras: Company Snapshot
7 Appendix
7.1 Methodology
This report identifies and benchmarks the best lubricant manufacturers such as Royal Dutch Shell Plc. (Netherlands), ExxonMobil Corporation (U.S.), Chevron Corporation (U.S.), BP p.l.c. (U.K.), Total S.A. (France), and evaluates them on the basis of business strategy excellence and strength of product portfolio within the Lubricants ecosystem, combining inputs from various industry experts, buyers, and vendors, and extensive secondary research including annual reports, company press releases, investor presentations, free and paid company databases. They are rated and positioned on 2x2 matrix, called as ‘Company Evaluation Quadrant’, and identified as Visionary Leaders, Dynamic Differentiators, Innovators, or Emerging companies.
SAMPLES:
- Updated version of this Quadrant
- Different Company Evaluation Quadrant
- 'Startup Only' Company Evaluation Quadrant
- Region or Country specific evaluation
- Application or Industry specific evaluation ..Read More
- Submit a Briefing Request
- Question about our published research
- Request for evaluation of your organization for specific market
- Request for re-evaluation of Company Evaluation Quadrant ..Read More
