LiDAR Quadrant Report
Table of Contents
1 Introduction
1.1 Market Definition
2 Market Overview
2.1 Introduction
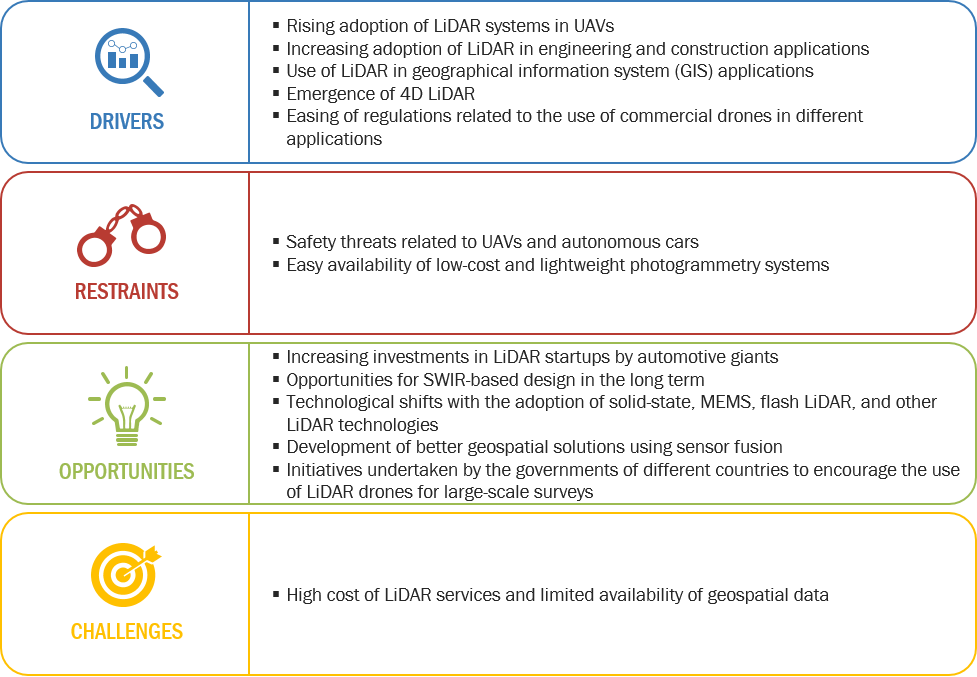
2.2 Market Dynamics
Figure 1 LiDAR Market Dynamics
2.2.1 Drivers
2.2.1.1 Rising Adoption of LiDAR Systems in UAVs
2.2.1.2 Increasing Adoption of LiDAR in Engineering and Construction Applications
2.2.1.3 Use of LiDAR in Geographical Information System (GIS) Applications
2.2.1.4 Emergence of 4D LiDAR
2.2.1.5 Easing of Regulations Related to the Use of Commercial Drones in Different Applications
Figure 2 LiDAR Market Drivers and Their Impact
2.2.2 Restraints
2.2.2.1 Safety Threats Related to UAVs and Autonomous Cars
2.2.2.2 Easy Availability of Low-Cost and Lightweight Photogrammetry Systems
Figure 3 LiDAR Market Restraints and Their Impact
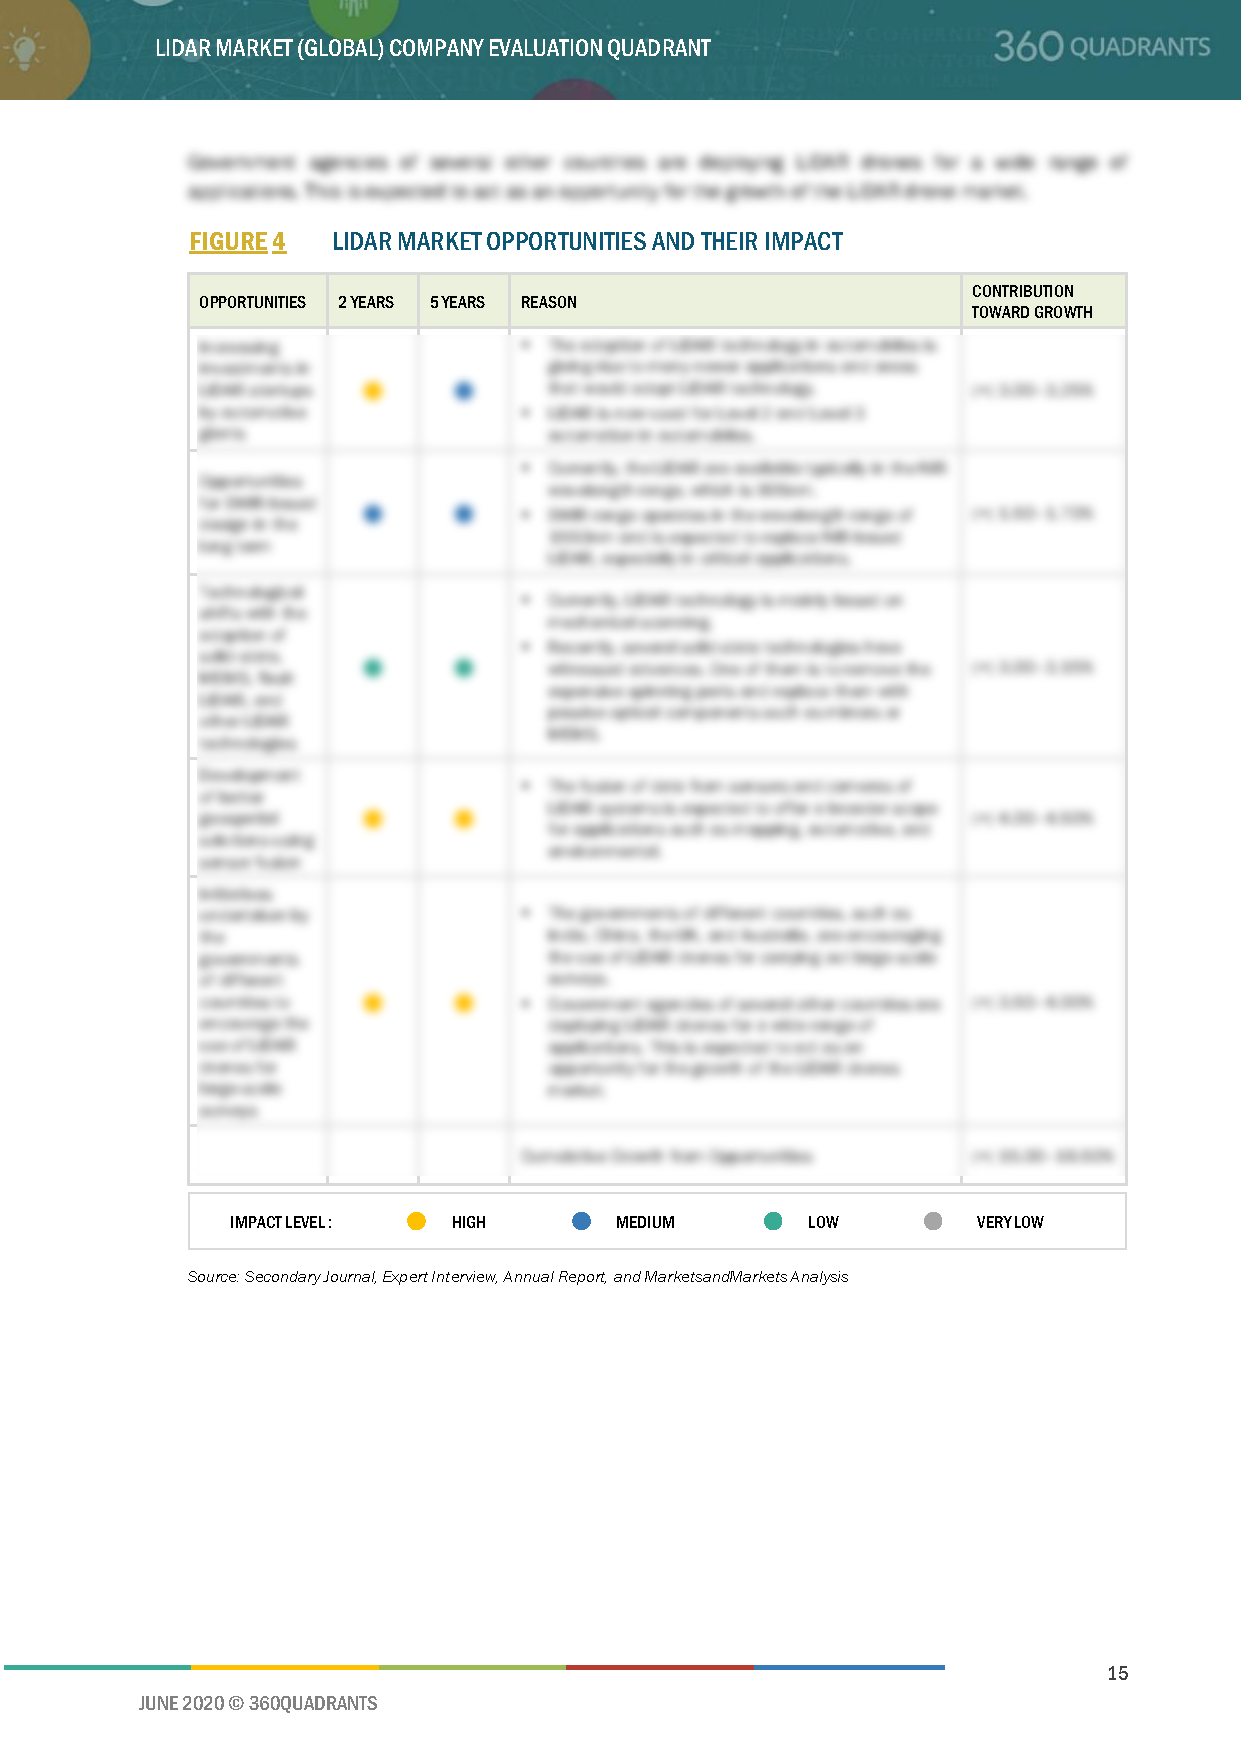
2.2.3 Opportunities
2.2.3.1 Increasing Investments in LiDAR Startups By Automotive Giants
2.2.3.2 Opportunities for SWIR-Based Design in the Long Term
2.2.3.3 Technological Shifts With the Adoption of Solid-State, Mems, Flash LiDAR, and Other LiDAR Technologies
2.2.3.4 Development of Better Geospatial Solutions Using Sensor Fusion
2.2.3.5 Initiatives Undertaken By the Governments of Different Countries to Encourage the Use of LiDAR Drones for Large-Scale Surveys
Figure 4 LiDAR Market Opportunities and Their Impact
2.2.4 Challenges
2.2.4.1 High Cost of LiDAR Services and Limited Availability of Geospatial Data
Figure 5 LiDAR Market Challenges and Their Impact
2.3 LiDAR Value Chain
Figure 6 LiDAR Ecosystem: Major Value Addition By LiDAR Component Manufacturers and Their Integrators & Distributors
3 Case Studies
3.1 Game of Thrones (Vektra, D.O.O. and Teledyne Optech)
3.2 Redesigning Roads With UAV (Yellowscan and Velodyne LiDAR, Inc.)
3.3 Visualizing the Site of the Chernobyl Red Forest (Routescene and Velodyne LiDAR, Inc.)
3.4 Improving Transportation for People With Disabilities (Robotic Research and Velodyne LiDAR, Inc.)
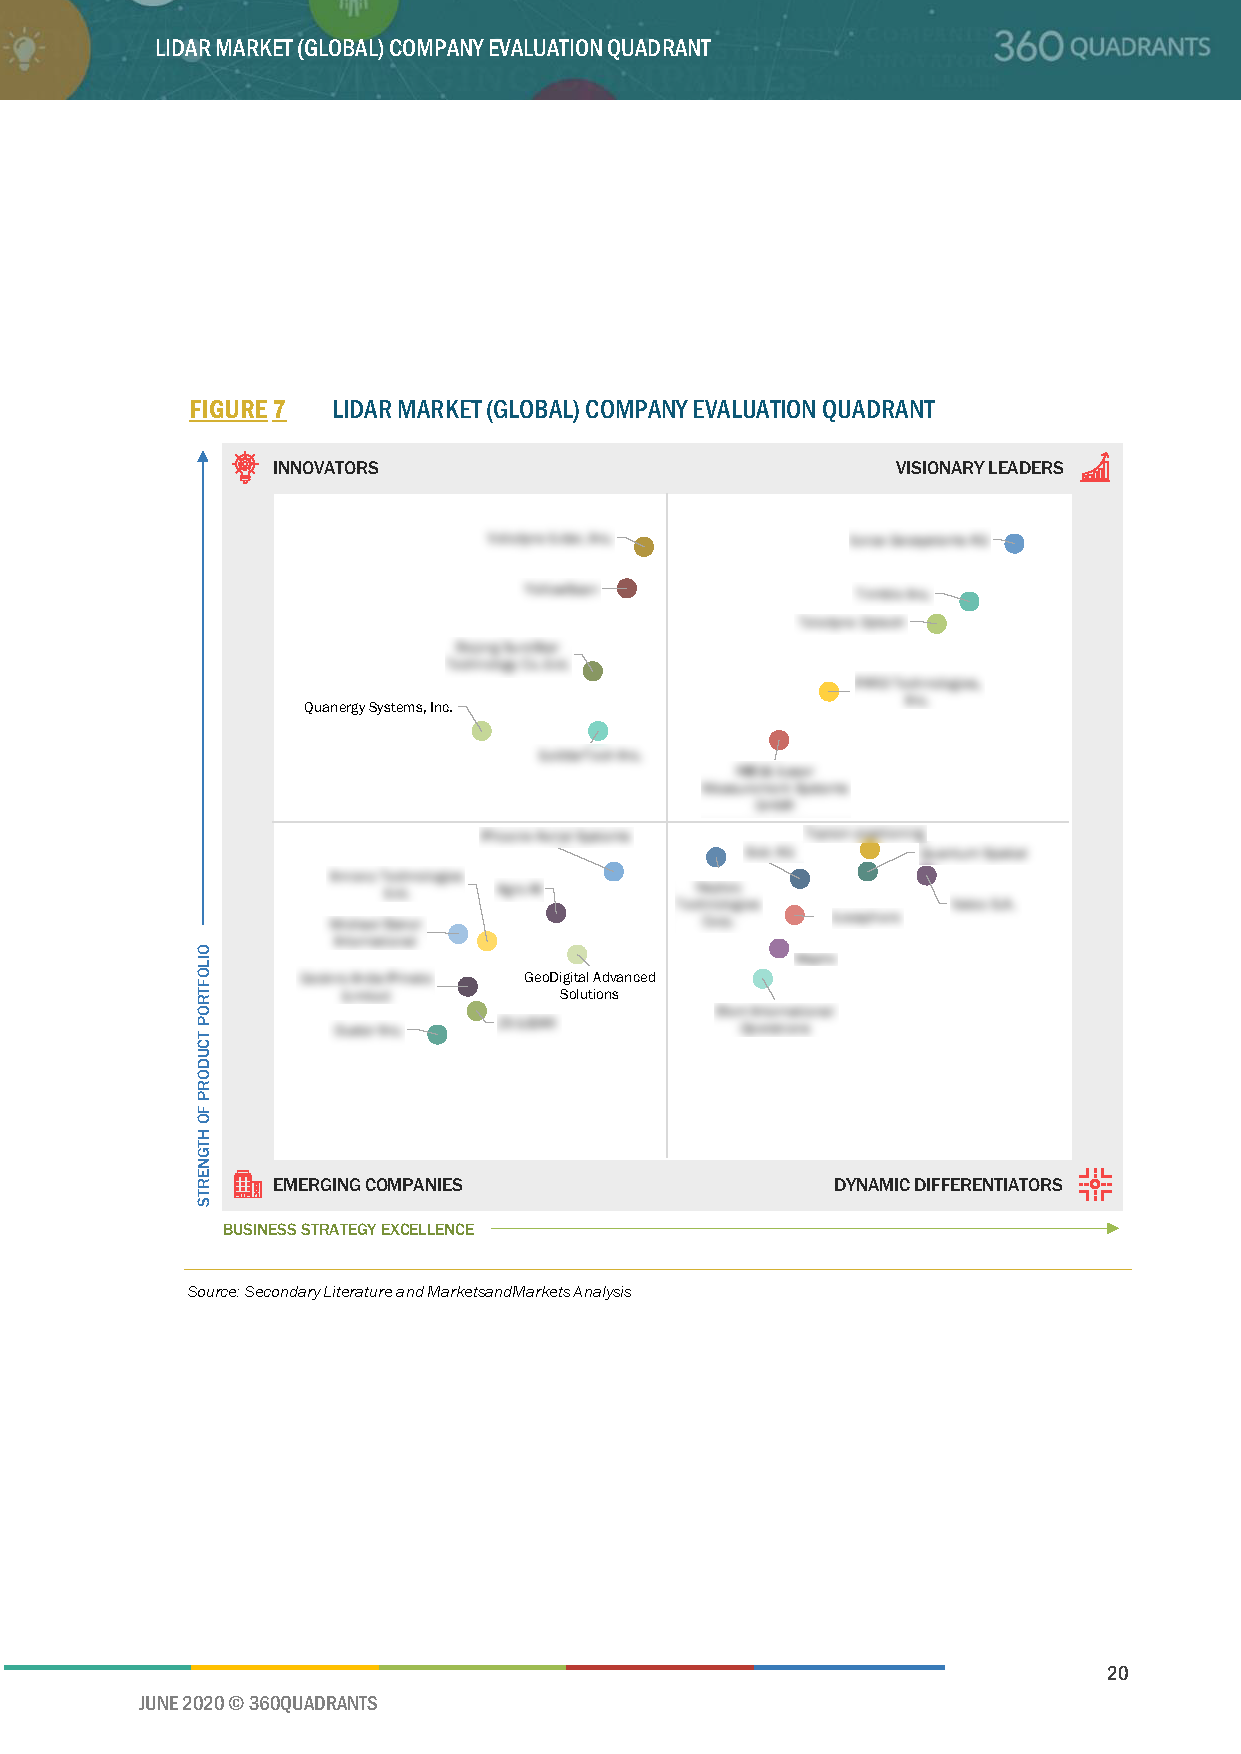
4 Company Evaluation Quadrant
4.1 Visionary Leaders
4.2 Innovators
4.3 Dynamic Differentiators
4.4 Emerging Players
Figure 7 LiDAR Market (Global) Company Evaluation Quadrant
5 Competitive Landscape
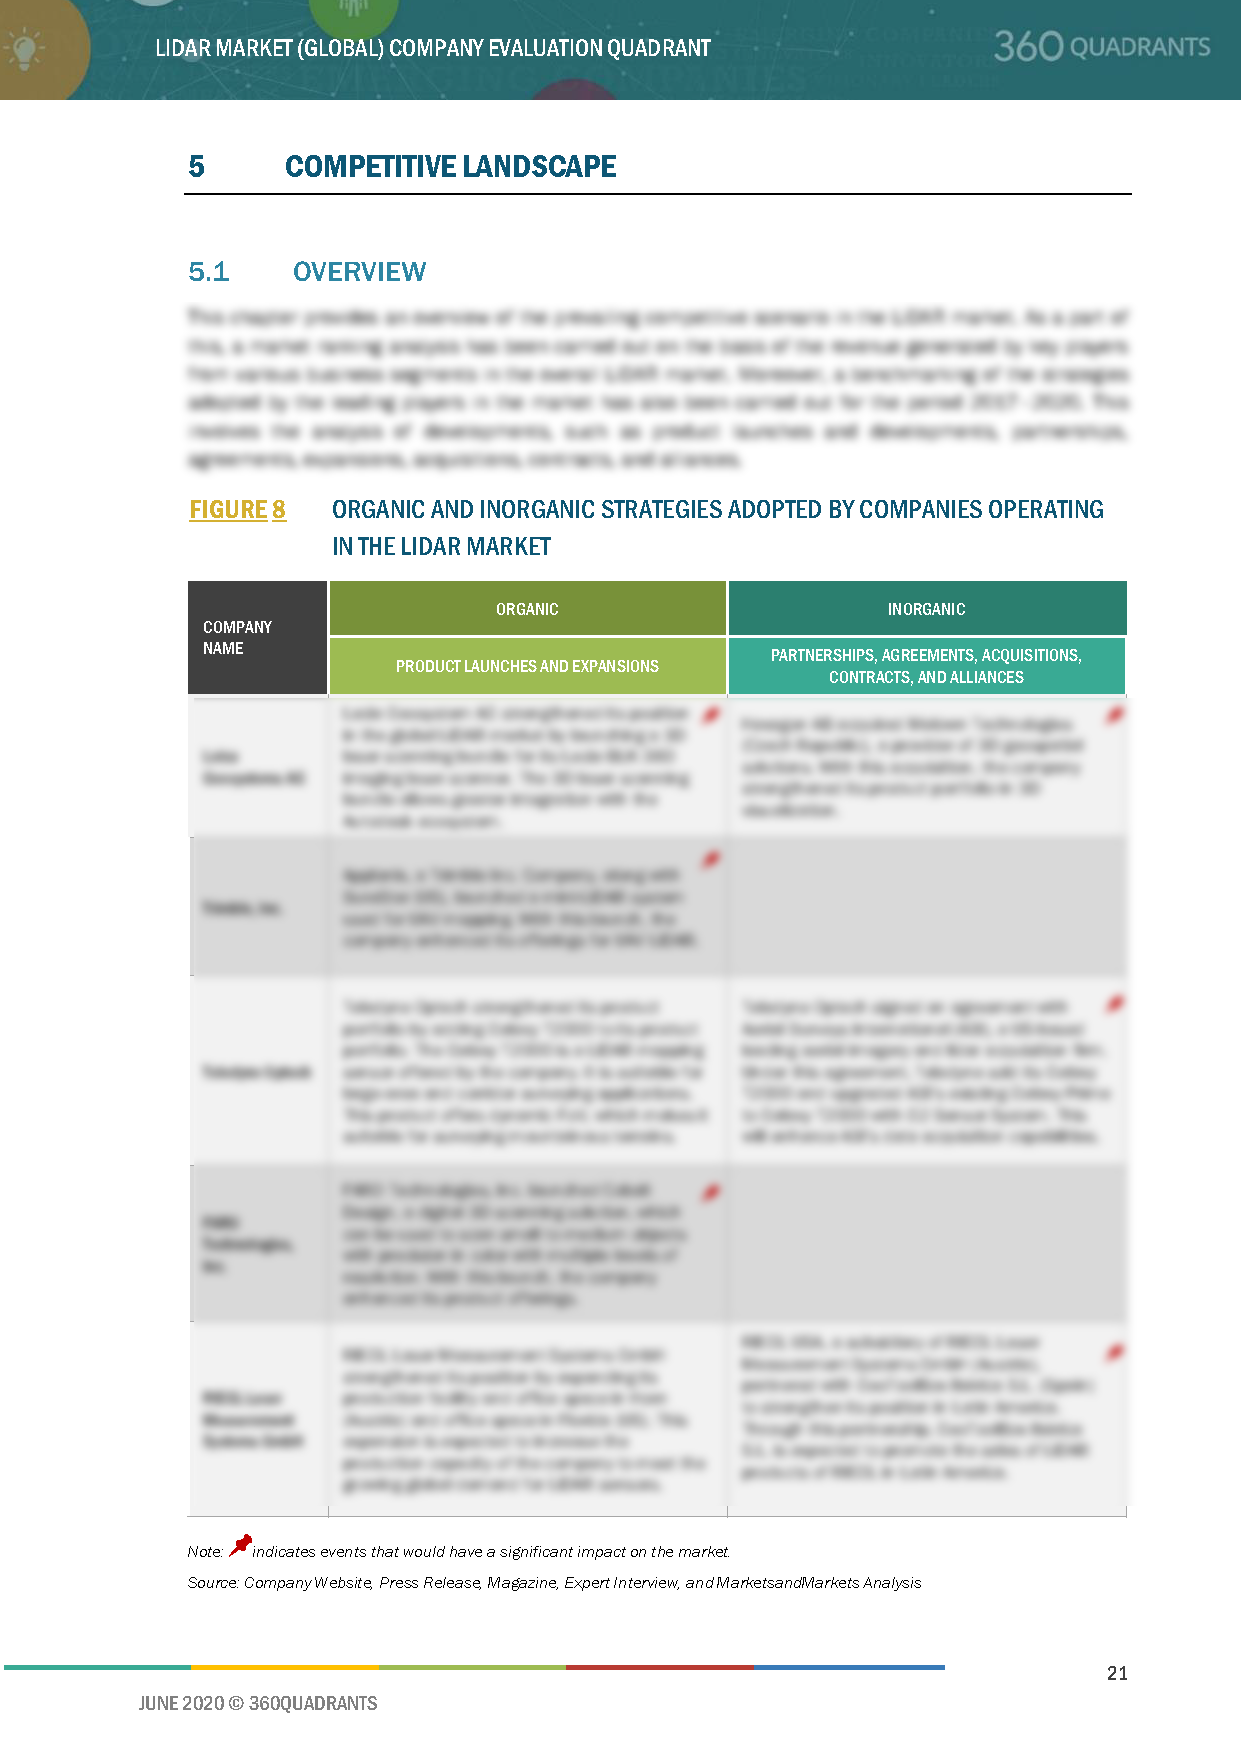
5.1 Overview
Figure 8 Organic and Inorganic Strategies Adopted By Companies Operating in the LiDAR Market
5.2 Market Ranking Analysis, 2019
Figure 9 Ranking of Top Five Players in the LiDAR Market
5.2.1 Product Launches and Developments
Table 1 Product Launches and Developments, 2017–2020
5.2.2 Partnerships, Agreements, Contracts, and Alliances
Table 2 Partnerships, Agreements, Contracts, and Alliances, 2017–2020
5.2.3 Expansions
Table 3 Expansions, 2018–2020
5.2.4 Acquisitions
Table 4 Acquisitions, 2018–2019
5.3 Right to Win (Company Business Snapshot)
6 Company Profiles
6.1 Introduction
6.2 Leica Geosystems AG
6.2.1 Business Overview*
6.2.2 Products and Solutions Offered*
6.2.3 Recent Developments*
6.2.4 SWOT Analysis*
6.2.5 MnM View*
(*Above sections are present for all of below companies)
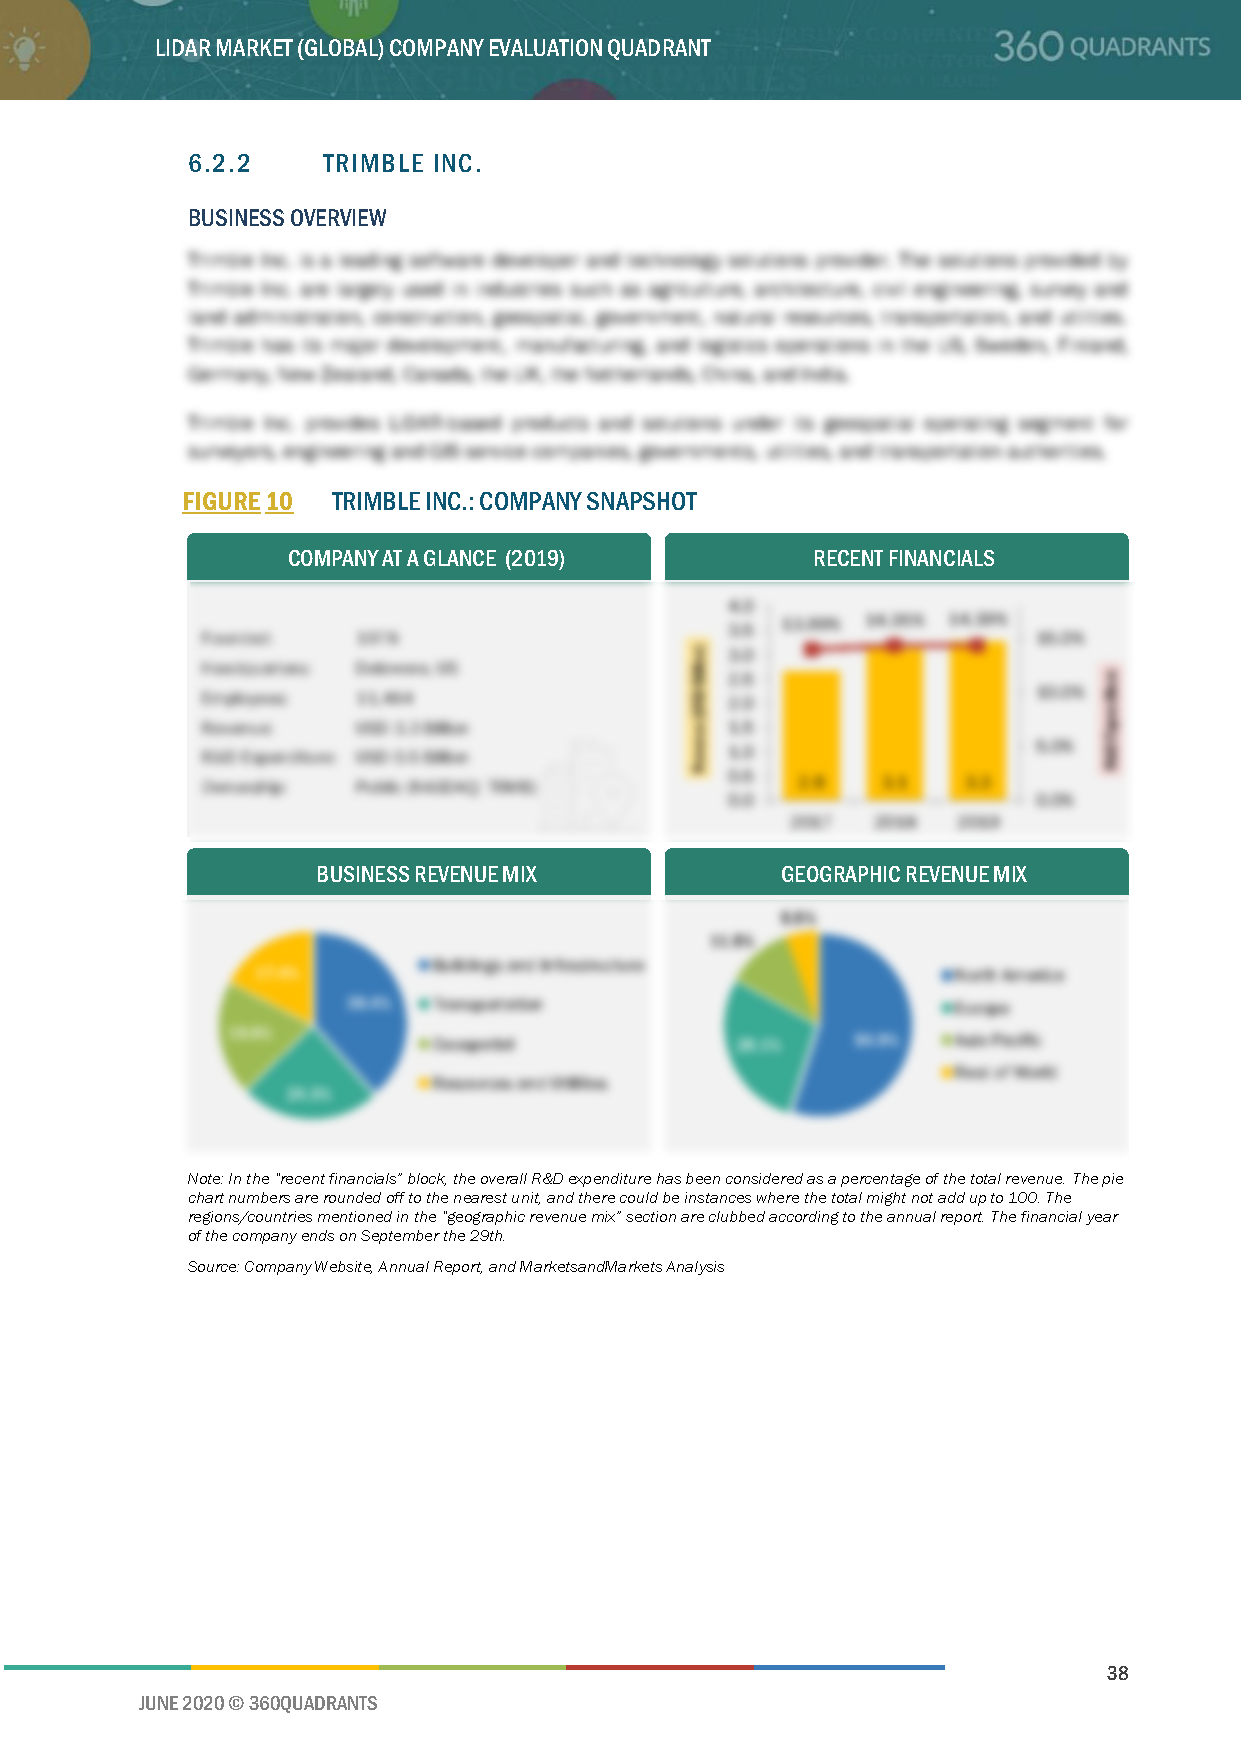
6.3 Trimble Inc.
Figure 10 Trimble Inc.: Company Snapshot
6.4 Teledyne Optech
6.5 Faro Technologies, Inc.
Figure 11 Faro Technologies, Inc.: Company Snapshot
6.6 RIEGL Laser Measurement Systems GmbH
6.7 Sick AG
Figure 12 Sick AG: Company Snapshot
6.8 Quantum Spatial
6.9 Beijing Surestar Technology Co. Ltd.
6.10 Velodyne LiDAR, Inc.
6.11 YellowScan
7 Appendix
7.1 Other Significant Players
7.1.1 Geokno India Private Limited
7.1.2 Phoenix LiDAR Systems
7.1.3 LeddarTech Inc.
7.1.4 Quanergy Systems, Inc.
7.1.5 Innoviz Technologies Ltd.
7.1.6 Leosphere
7.1.7 Waymo LLC
7.1.8 Valeo S.A.
7.1.9 Neptec Technologies Corp.
7.1.10 Ouster, Inc.
7.1.11 ZX LiDARs
7.2 Methodology
This report identifies and benchmarks the best LiDAR manufacturers such as Leica Geosystems AG (Sweden), Trimble, Inc. (US), Teledyne Optech (Canada), FARO Technologies, Inc. (US) and RIEGL Laser Measurement Systems GmbH (Austria), and evaluates them on the basis of business strategy excellence and strength of product portfolio within the LiDAR ecosystem, combining inputs from various industry experts, buyers, and vendors, and extensive secondary research including annual reports, company press releases, investor presentations, free and paid company databases. They are rated and positioned on a 2x2 matrix, called ‘Company Evaluation Quadrant’, and identified as Visionary Leaders, Dynamic Differentiators, Innovators, or Emerging companies.
SAMPLES:
- Updated version of this Quadrant
- Different Company Evaluation Quadrant
- 'Startup Only' Company Evaluation Quadrant
- Region or Country specific evaluation
- Application or Industry specific evaluation ..Read More
- Submit a Briefing Request
- Question about our published research
- Request for evaluation of your organization for specific market
- Request for re-evaluation of Company Evaluation Quadrant ..Read More
