Contract Research Organization Services (CRO) Quadrant Report
This report identifies and benchmarks world’s best companies in the CRO services market such as IQVIA (US), LabCorp (US), PAREXEL (US), PRA Health Sciences (US), PPD (US), and evaluates them on the basis of business strategy excellence and strength of product portfolio within the CRO services ecosystem, combining inputs from various industry experts, buyers, and vendors, and extensive secondary research including annual reports, company press releases, investor presentations, free and paid company databases. They are rated and positioned on 2x2 matrix, called as ‘Company Evaluation Quadrant’, and identified as Visionary Leaders (top companies), Dynamic Differentiators, Innovators, or Emerging companies.
The report includes market specific company profiles of all 20 players and assesses the recent developments that shape the competitive landscape of this highly fragmented market.
Market growth in the CRO services market can be attributed to the growing R&D expenditure, increased outsourcing of R&D activities, and an increasing number of clinical trials.
Contract Research Organizations (CROs) provide various contract research services for various drug development phases to various sponsor/end-user segments such as Pharmaceutical & biopharmaceutical companies, medical device companies, and academic institutions.
The global Contract Research Organization (CRO) services market is projected to reach USD 74 billion by 2025 at a CAGR of 9.1%. Growing R&D expenditure, increased outsourcing of R&D activities, an increasing number of clinical trials, rising costs of in-house drug development and increasing prevalence of orphan and rare diseases are some of the major factor driving growth for the Contract Research Organization (CRO) services market.
List of companies evaluated and profiled in the report:
- ACCULAB LIFE SCIENCES
- AXCENT ADVANCED ANALYTICS
- AZELIX
- BIOAGILE THERAPEUTICS
- CHARLES RIVER LABORATORIES
- CTSERV
- DOVE QUALITY SOLUTIONS
- FIRMA CLINICAL RESEARCH
- ICON PLC
- IQVIA
- LABCORP
- MEDPACE HOLDINGS
- PAREXEL INTERNATIONAL
- PEPGRA
- PPD
- PRA HEALTH SCIENCES
- PSI CRO AG
- SGS
- SYNEOS HEALTH INC.
- WUXI APPTEC
Table of Contents
1 Introduction
1.1 Market Definition
2 Market Overview
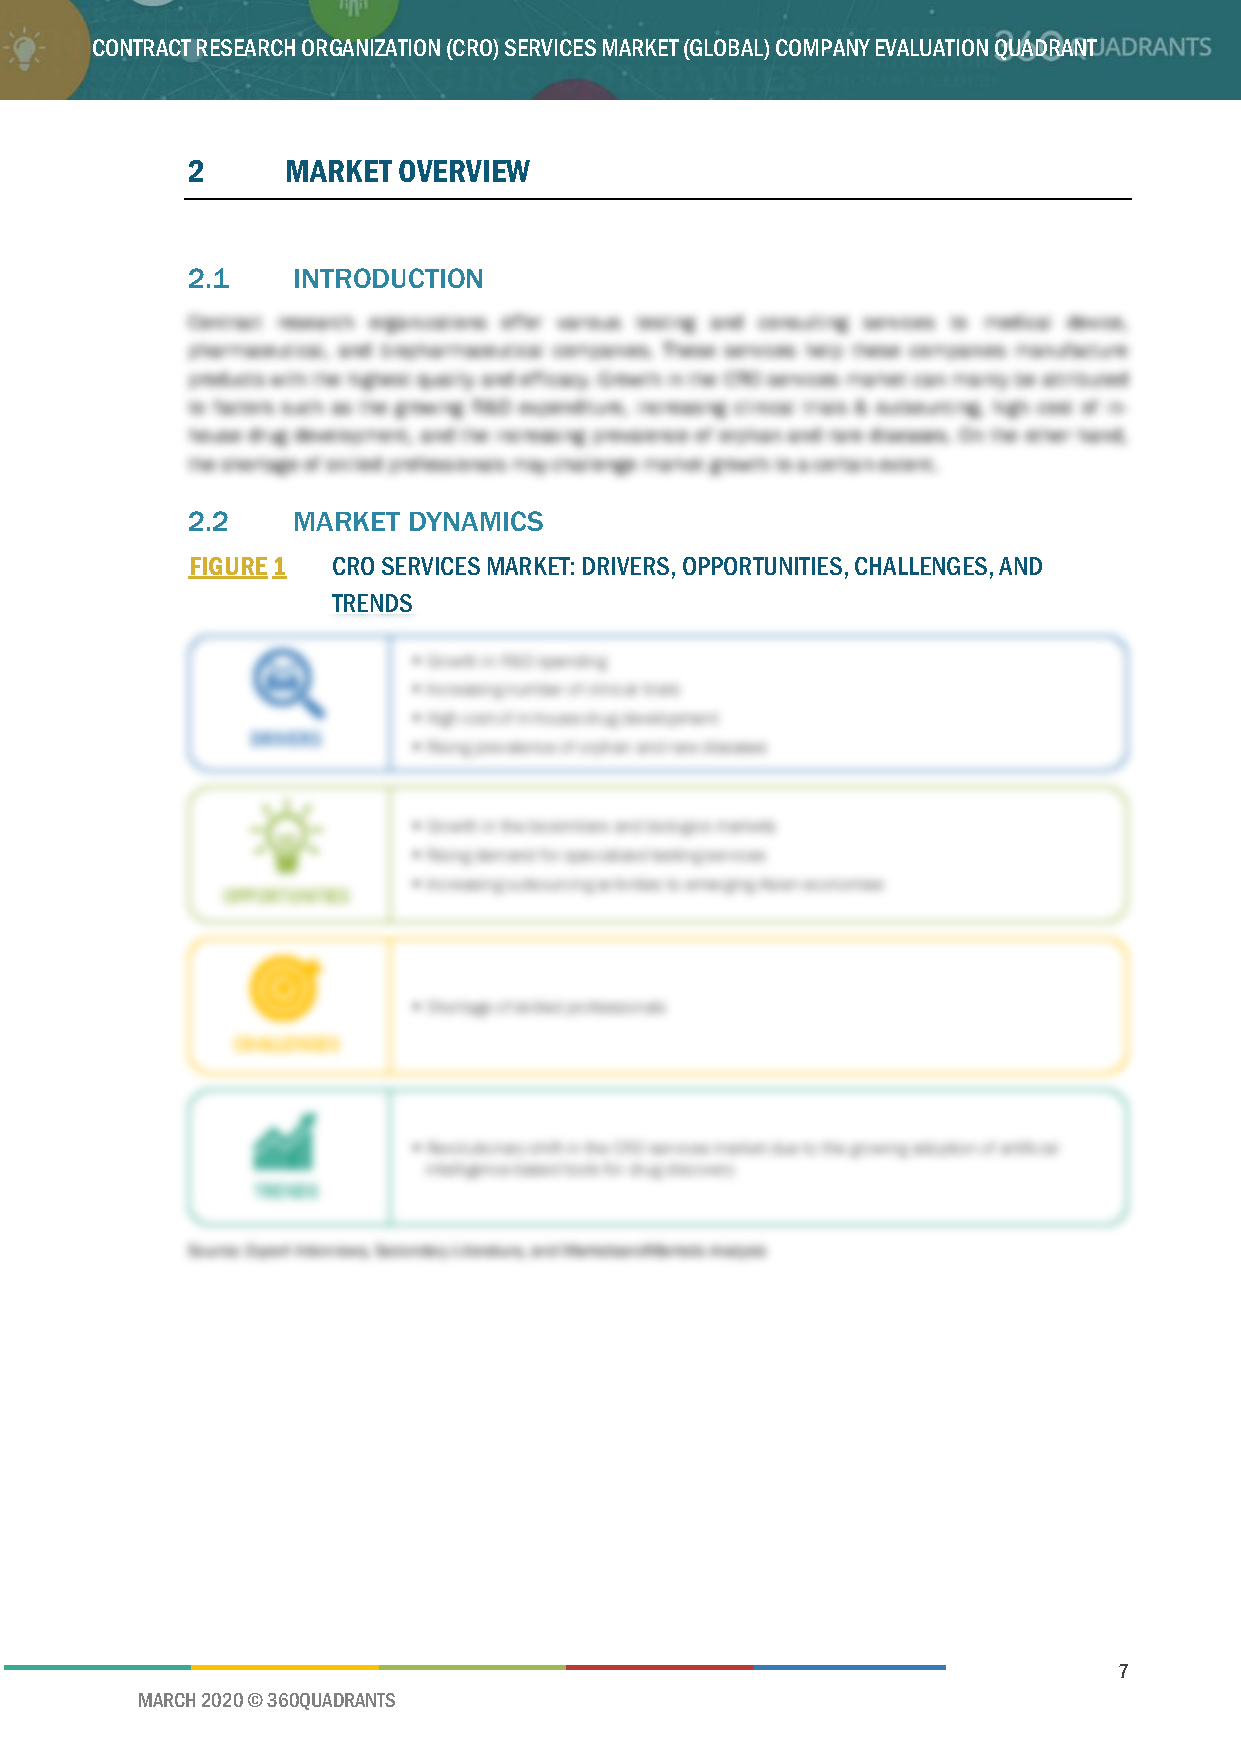
2.1 Introduction
2.2 Market Dynamics
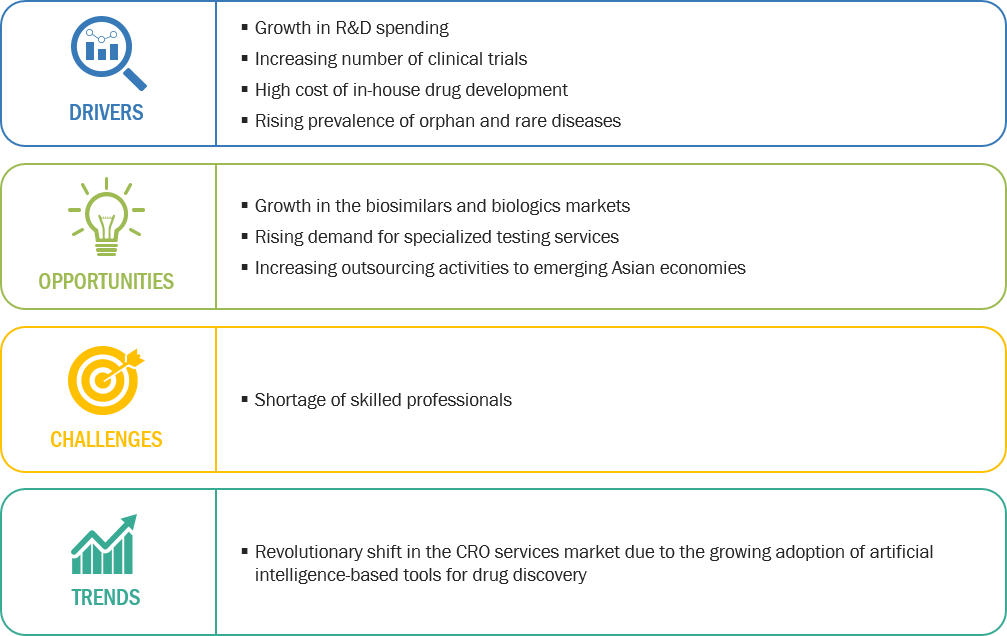
Figure 1 CRO Services Market: Drivers, Opportunities, Challenges, and Trends
2.2.1 Drivers
2.2.1.1 Growth in R&D Spending
Figure 2 Increasing R&D Spending of Pharma Member Companies, 2010–2018
Figure 3 Active Pharmaceutical Pipeline, 2009–2019
2.2.1.2 Increasing Number of Clinical Trials
Figure 4 Increasing Number of Clinical Trials Worldwide (2002–2020)
2.2.1.3 High Cost of In-House Drug Development
Figure 5 Average Cost to Develop A Pharmaceutical Compound From Discovery to Launch, 2013–2019 (USD Billion)
2.2.1.4 Rising Prevalence of Orphan and Rare Diseases
Table 1 Research Projects Funded By the International Rare Diseases Research Consortium, 2019
2.2.2 Opportunities
2.2.2.1 Growth in the Biosimilars and Biologics Markets
Figure 6 Total Number of New Biologic License Application Filings, Approvals, and NDA Approvals (2005–2019)
Table 2 List of Biological License Application Approvals in the US, 2019
2.2.2.2 Rising Demand for Specialized Testing Services
2.2.2.3 Increasing Outsourcing Activities to Emerging Asian Economies
2.2.3 Challenges
2.2.3.1 Shortage of Skilled Professionals
2.2.4 Trends
2.2.4.1 Revolutionary Shift in the CRO Services Market Due to the Growing Adoption of Artificial Intelligence-Based Tools for Drug Discovery
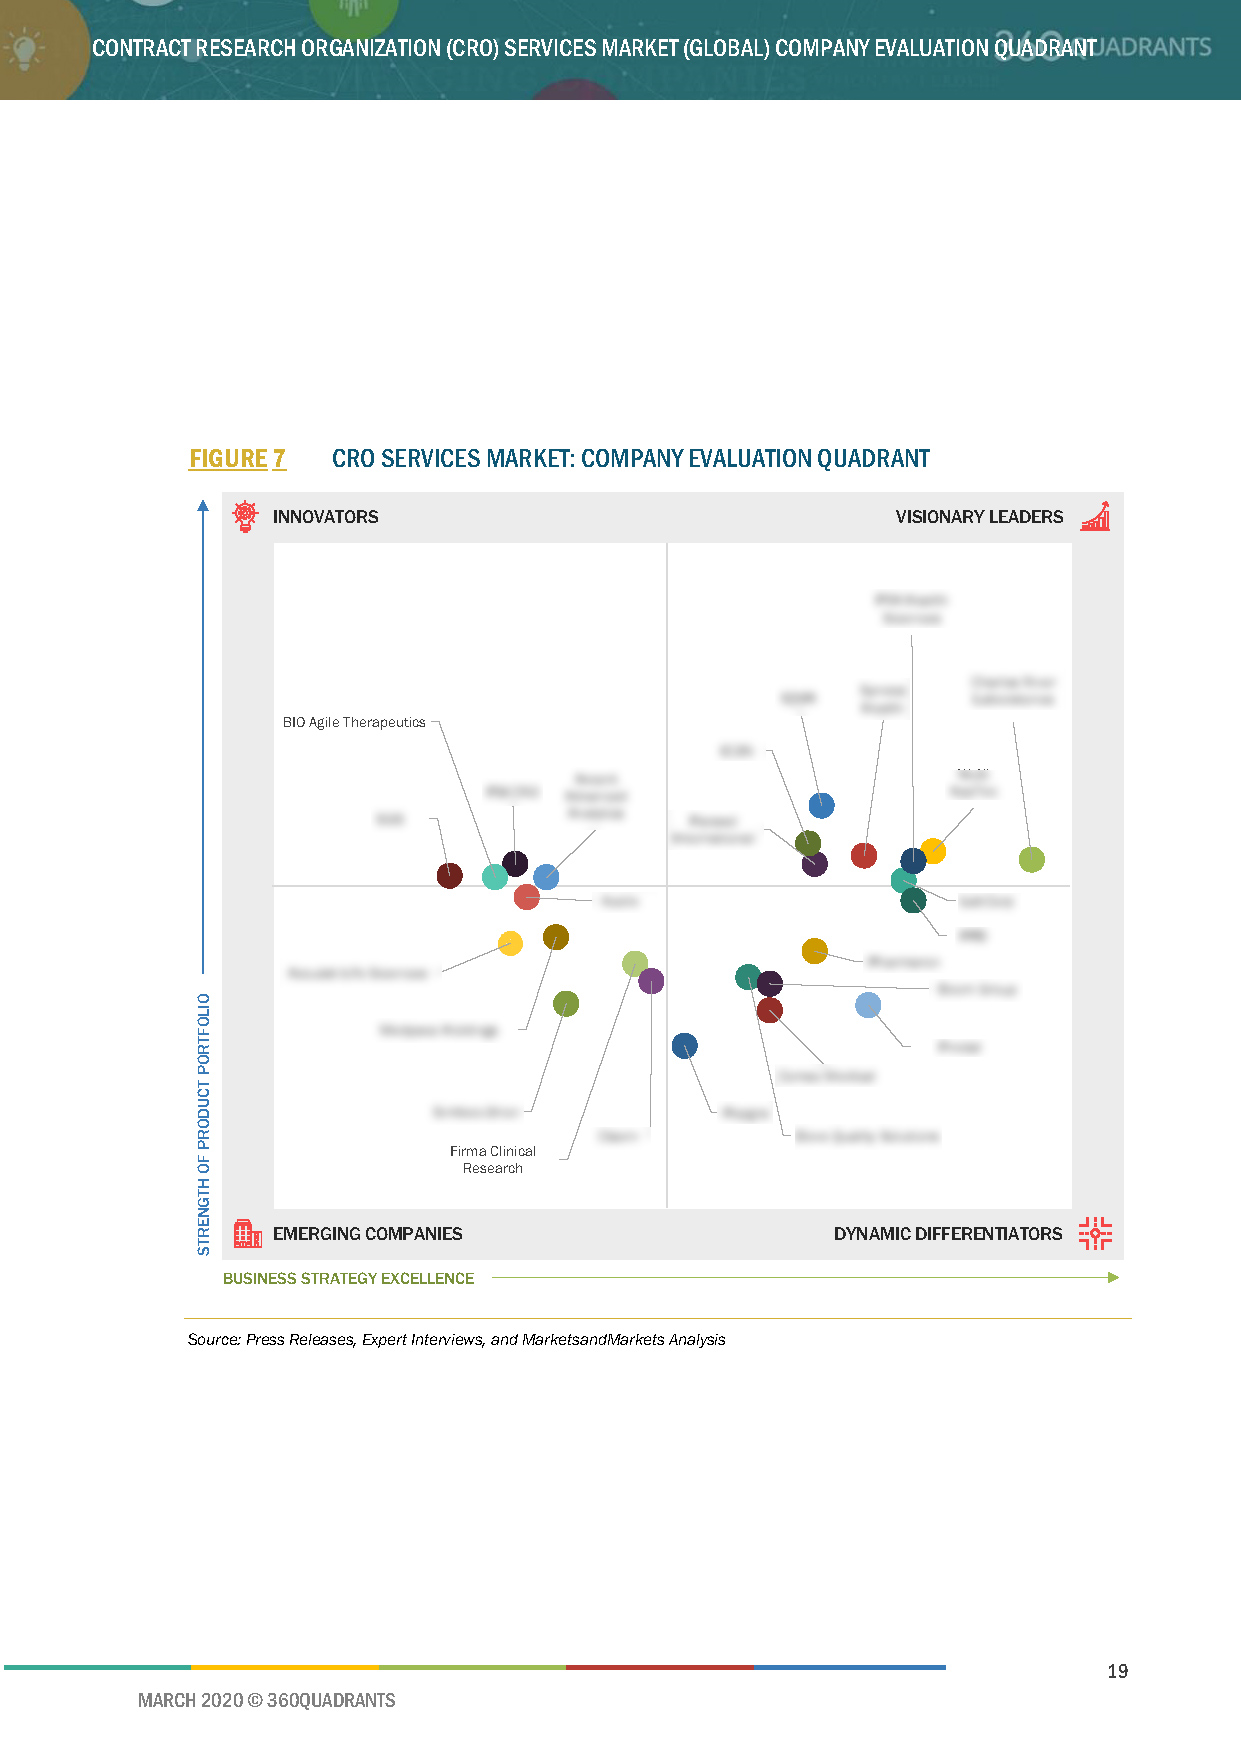
3 Company Evaluation Quadrant
3.1 Company Evaluation Quadrant
3.1.1 Visionary Leaders
3.1.2 Innovators
3.1.3 Dynamic Differentiators
3.1.4 Emerging Companies
Figure 7 CRO Services Market: Company Evaluation Quadrant
4 Competitive Landscape
4.1 Overview
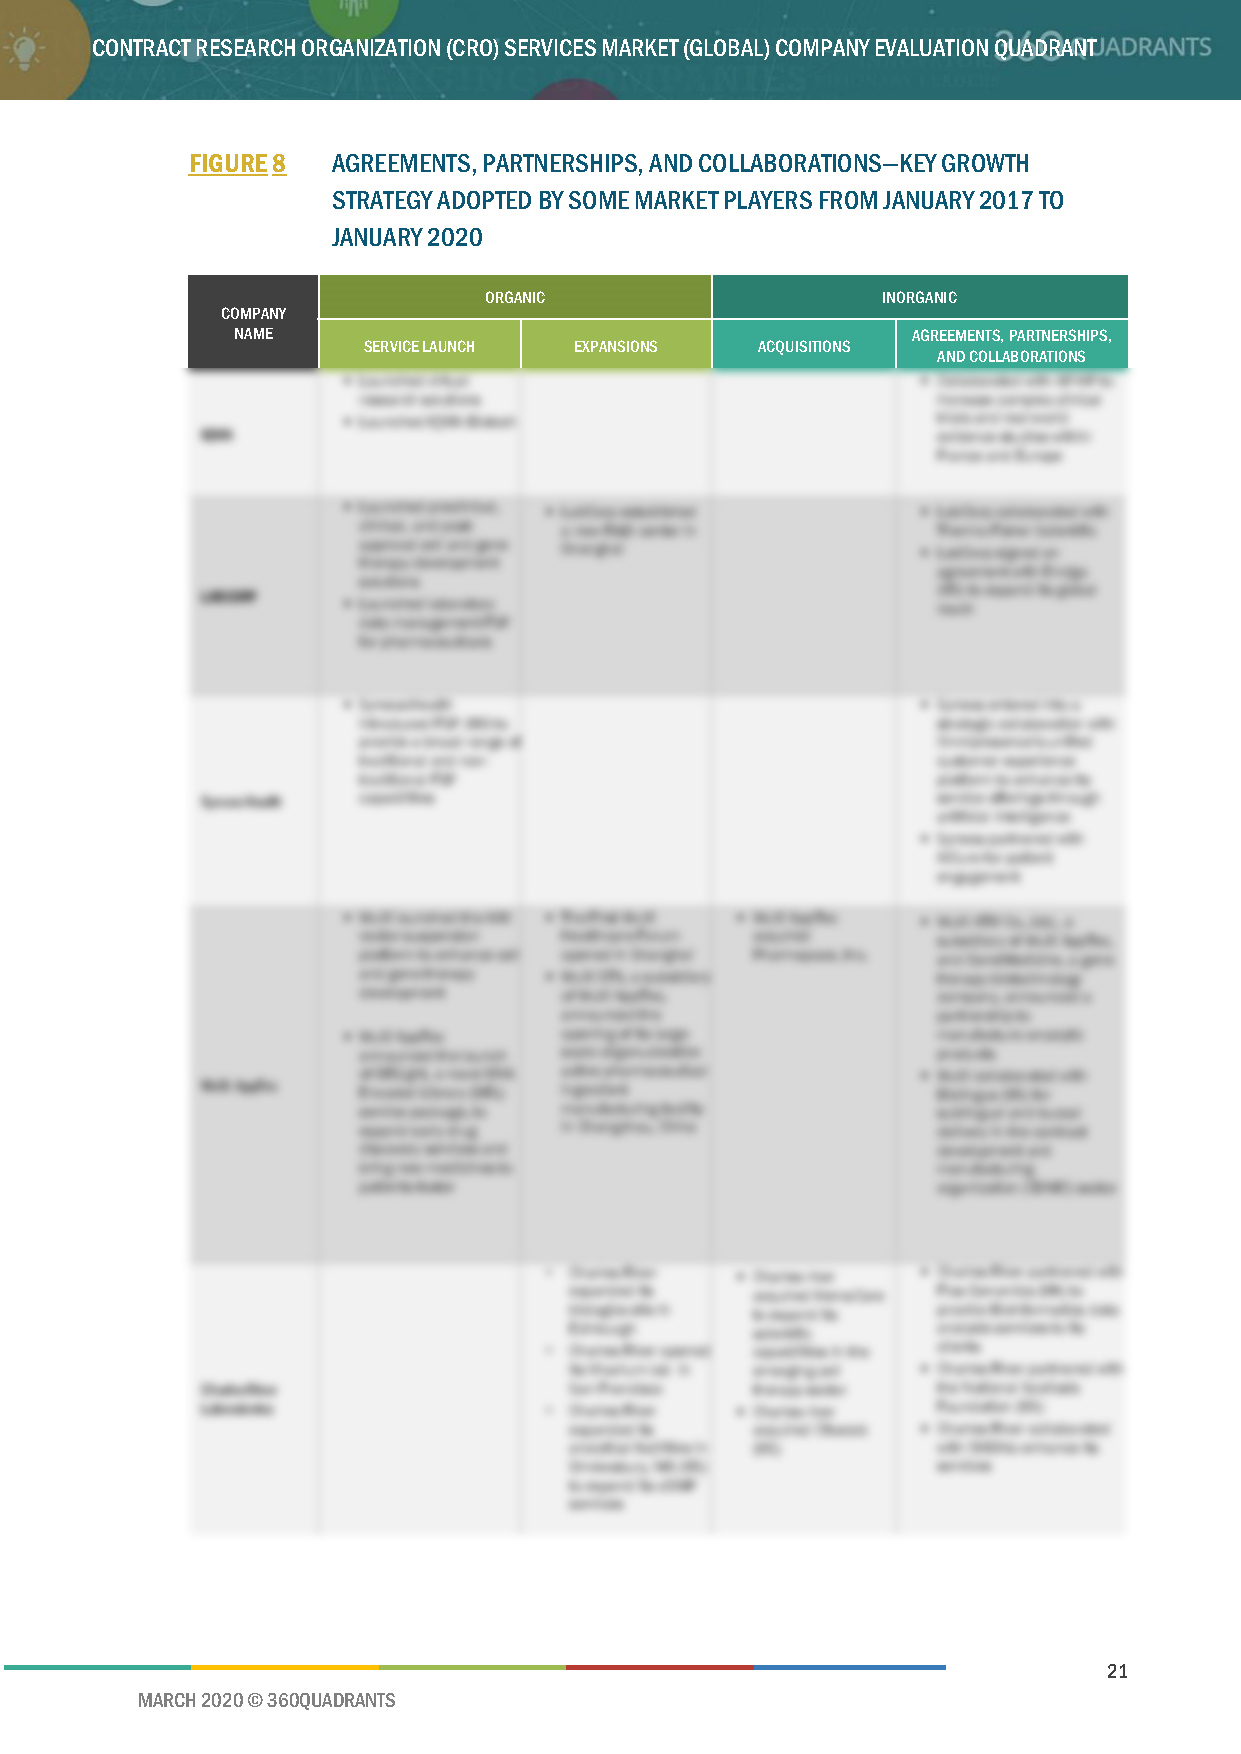
Figure 8 Agreements, Partnerships, and Collaborations—Key Growth Strategy Adopted By Some Market Players From January 2017 to January 2020
4.2 Market Share Analysis: CRO Services Market (2019)
Figure 9 CRO Services Market Share, By Key Player, 2019
4.3 Competitive Situation and Trends
4.3.1 Service Launches
Table 3 Service Launches, 2017–2020
4.3.2 Expansions
Table 4 Expansions, 2017–2020
4.3.3 Acquisitions
Table 5 Acquisitions, 2017–2020
4.3.4 Partnerships & Agreements
Table 6 Partnerships & Agreements, 2017–2020
5 Company Profiles
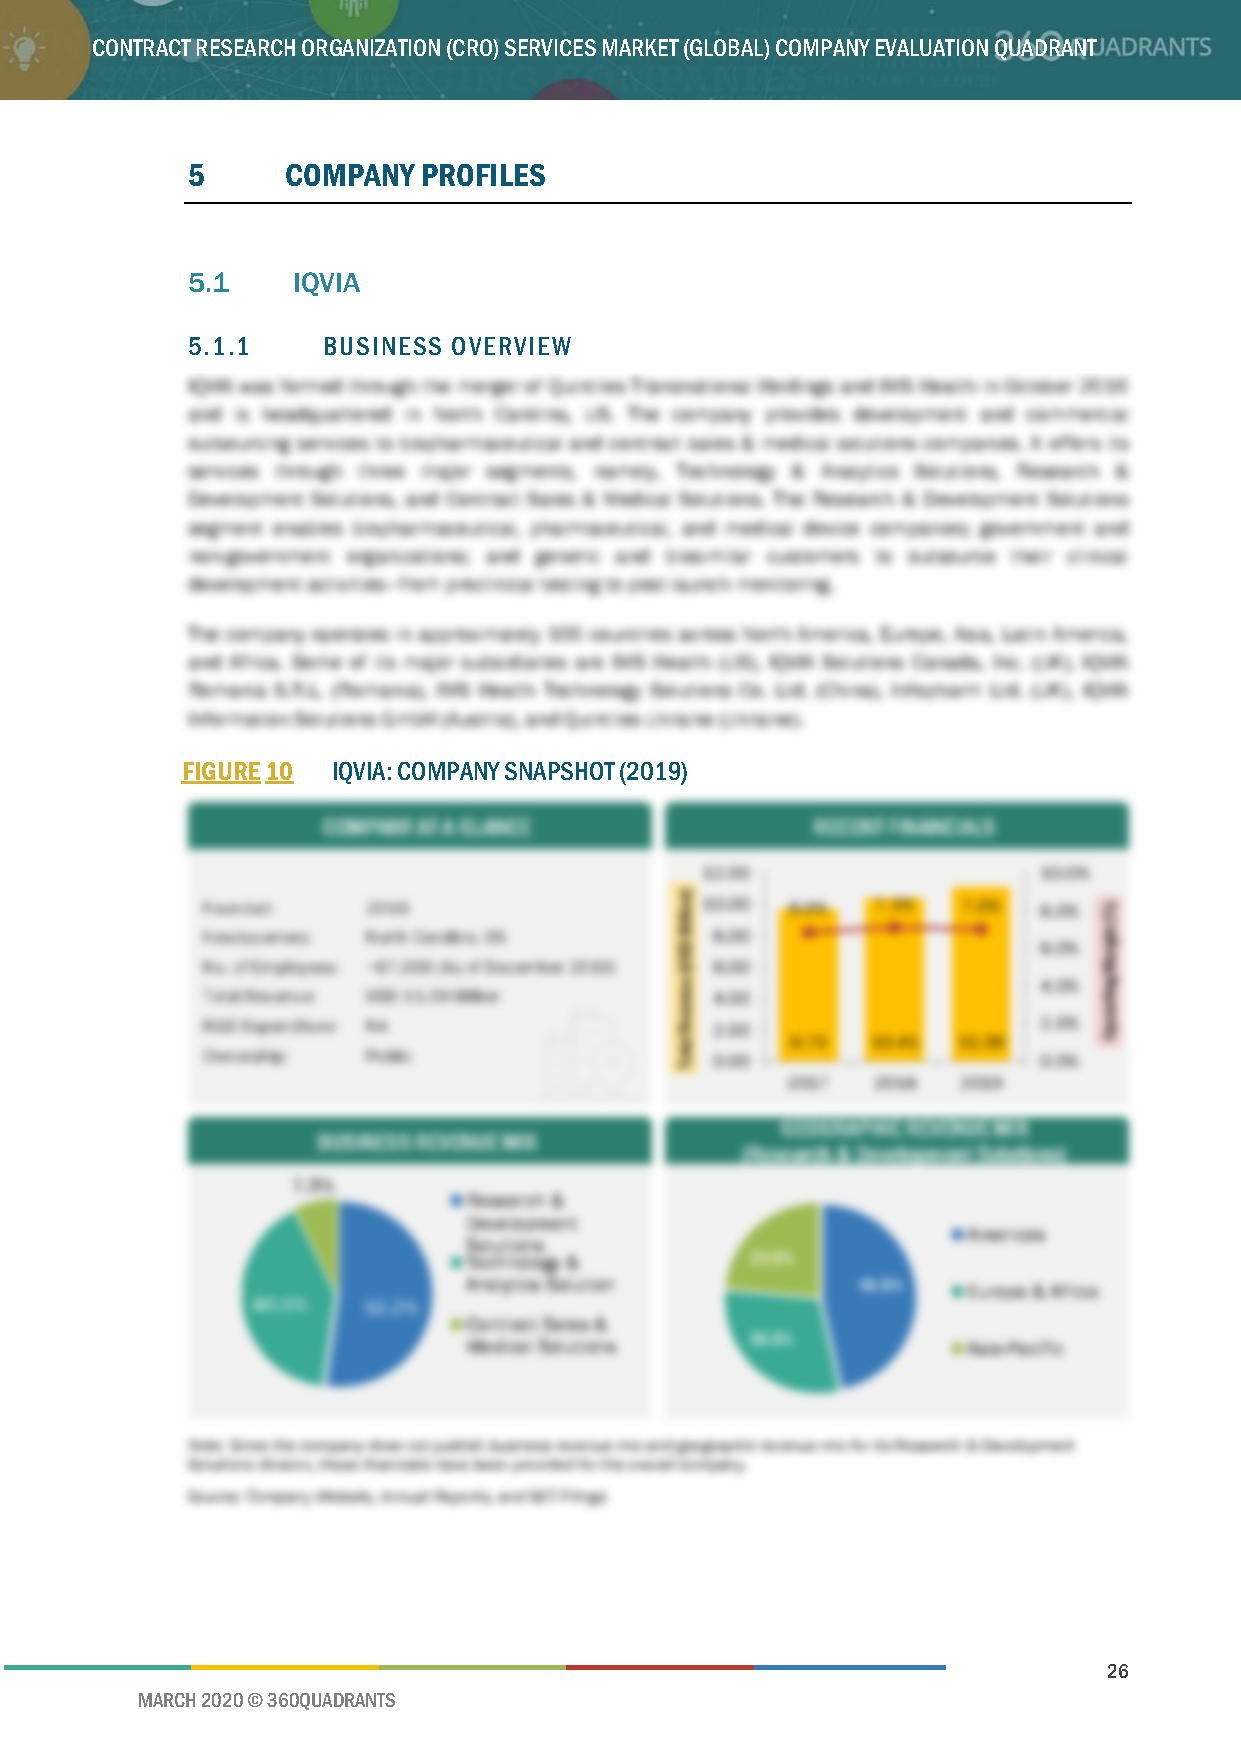
5.1 IQVIA
5.1.1 Business Overview*
Figure 10 IQVIA: Company Snapshot (2019)
5.1.2 Services Offered*
5.1.3 Recent Developments*
5.1.4 MnM View*
5.1.5 Strategic Overview*
(*Above sections are present for all of below companies)
5.2 LabCorp
Figure 11 LabCorp: Company Snapshot (2019)
5.3 Syneos Health Inc.
Figure 12 Syneos Health Inc.: Company Snapshot (2019)
5.4 WuXi AppTec
Figure 13 WuXi AppTec: Company Snapshot (2018)
5.5 Charles River Laboratories
Figure 14 Charles River Laboratories: Company Snapshot (2019)
5.6 Parexel International
5.7 PRA Health Sciences
Figure 15 PRA Health Sciences: Company Snapshot (2018)
5.8 PPD
5.9 ICON plc
Figure 16 ICON plc: Company Snapshot (2019)
5.10 Medpace Holdings
Figure 17 Medpace Holdings: Company Snapshot (2018)
5.11 SGS
Figure 18 SGS: Company Snapshot (2019)
5.12 PSI CRO AG
5.13 Axcent Advanced Analytics (A3)
5.14 BioAgile Therapeutics
5.15 Firma Clinical Research
6 Appendix
6.1 Other Significant Players
6.1.1 Acculab Life Sciences
6.1.2 Azelix
6.1.3 CTServ
6.1.4 PEPGRA
6.1.5 Dove Quality Solutions
6.2 Methodology
6.3 List of Abbreviations
This report identifies and benchmarks world’s best companies in the CRO services market such as IQVIA (US), LabCorp (US), PAREXEL (US), PRA Health Sciences (US), PPD (US), and evaluates them on the basis of business strategy excellence and strength of product portfolio within the CRO services ecosystem, combining inputs from various industry experts, buyers, and vendors, and extensive secondary research including annual reports, company press releases, investor presentations, free and paid company databases. They are rated and positioned on 2x2 matrix, called as ‘Company Evaluation Quadrant’, and identified as Visionary Leaders (top companies), Dynamic Differentiators, Innovators, or Emerging companies.
SAMPLES:
- Updated version of this Quadrant
- Different Company Evaluation Quadrant
- 'Startup Only' Company Evaluation Quadrant
- Region or Country specific evaluation
- Application or Industry specific evaluation ..Read More
- Submit a Briefing Request
- Question about our published research
- Request for evaluation of your organization for specific market
- Request for re-evaluation of Company Evaluation Quadrant ..Read More