Top 15 Bioplastic Companies, Worldwide 2023
Table of Contents
1 Introduction
1.1 Market Definition
2 Market Overview
2.1 Introduction
Figure 1 Bioplastics & Biopolymers: Supply Chain
Figure 2 Manufacturing Processes of Different Bioplastics & Biopolymers
2.1.1 Bio-PET
2.1.2 Bio-PE
2.1.3 PLA
2.1.4 PHA
2.1.5 Bio-PBS
2.1.6 Starch Blends
2.1.7 Regenerated Cellulose
2.2 Market Dynamics
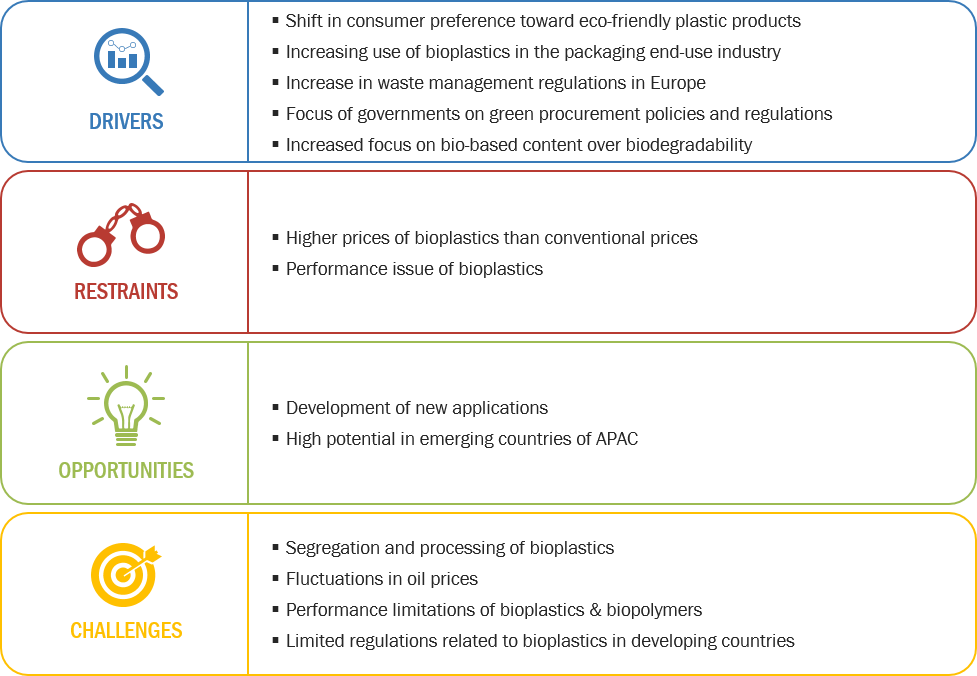
Figure 3 Drivers, Restraints, Opportunities, and Challenges in the Bioplastics & Biopolymers Market
2.2.1 Drivers
2.2.1.1 Shift in Consumer Preference Toward Eco-Friendly Plastic Products
Table 1 Adverse Health Effects Due to the Use of Conventional Plastics
2.2.1.2 Increasing Use of Bioplastics in the Packaging End-Use Industry
2.2.1.3 Increase in Waste Management Regulations in Europe
2.2.1.4 Focus of Governments on Green Procurement Policies and Regulations
Table 2 Regulations on the Use of Plastic Bags
2.2.1.5 Increased Focus on Bio-Based Content Over Biodegradability
2.2.2 Restraints
2.2.2.1 Higher Prices of Bioplastics Than Conventional Plastics
Figure 4 Global Bioplastics & Biopolymers Price Trend (20182025)
2.2.2.2 Performance Issue of Bioplastics
2.2.3 Opportunities
2.2.3.1 Development of New Applications
2.2.3.2 High Potential in Emerging Countries of APAC
2.2.4 Challenges
2.2.4.1 Segregation and Processing of Bioplastics
Figure 5 Biodegradable Bioplastics Life Cycle
2.2.4.2 Fluctuating Oil Prices
Figure 6 Crude Oil Prices From 2014 to 2020
2.2.4.3 Limited Regulations Related to Bioplastics in Developing Countries
2.2.5 Threat of New Entrants
2.2.6 Threat of Substitutes
2.2.7 Bargaining Power of Buyers
2.2.8 Bargaining Power of Suppliers
2.2.9 Intensity of Competitive Rivalry
3 Company Evaluation Quadrant
3.1 Visionary Leaders
3.2 Innovators
3.3 Dynamic Differentiators
3.4 Emerging Players
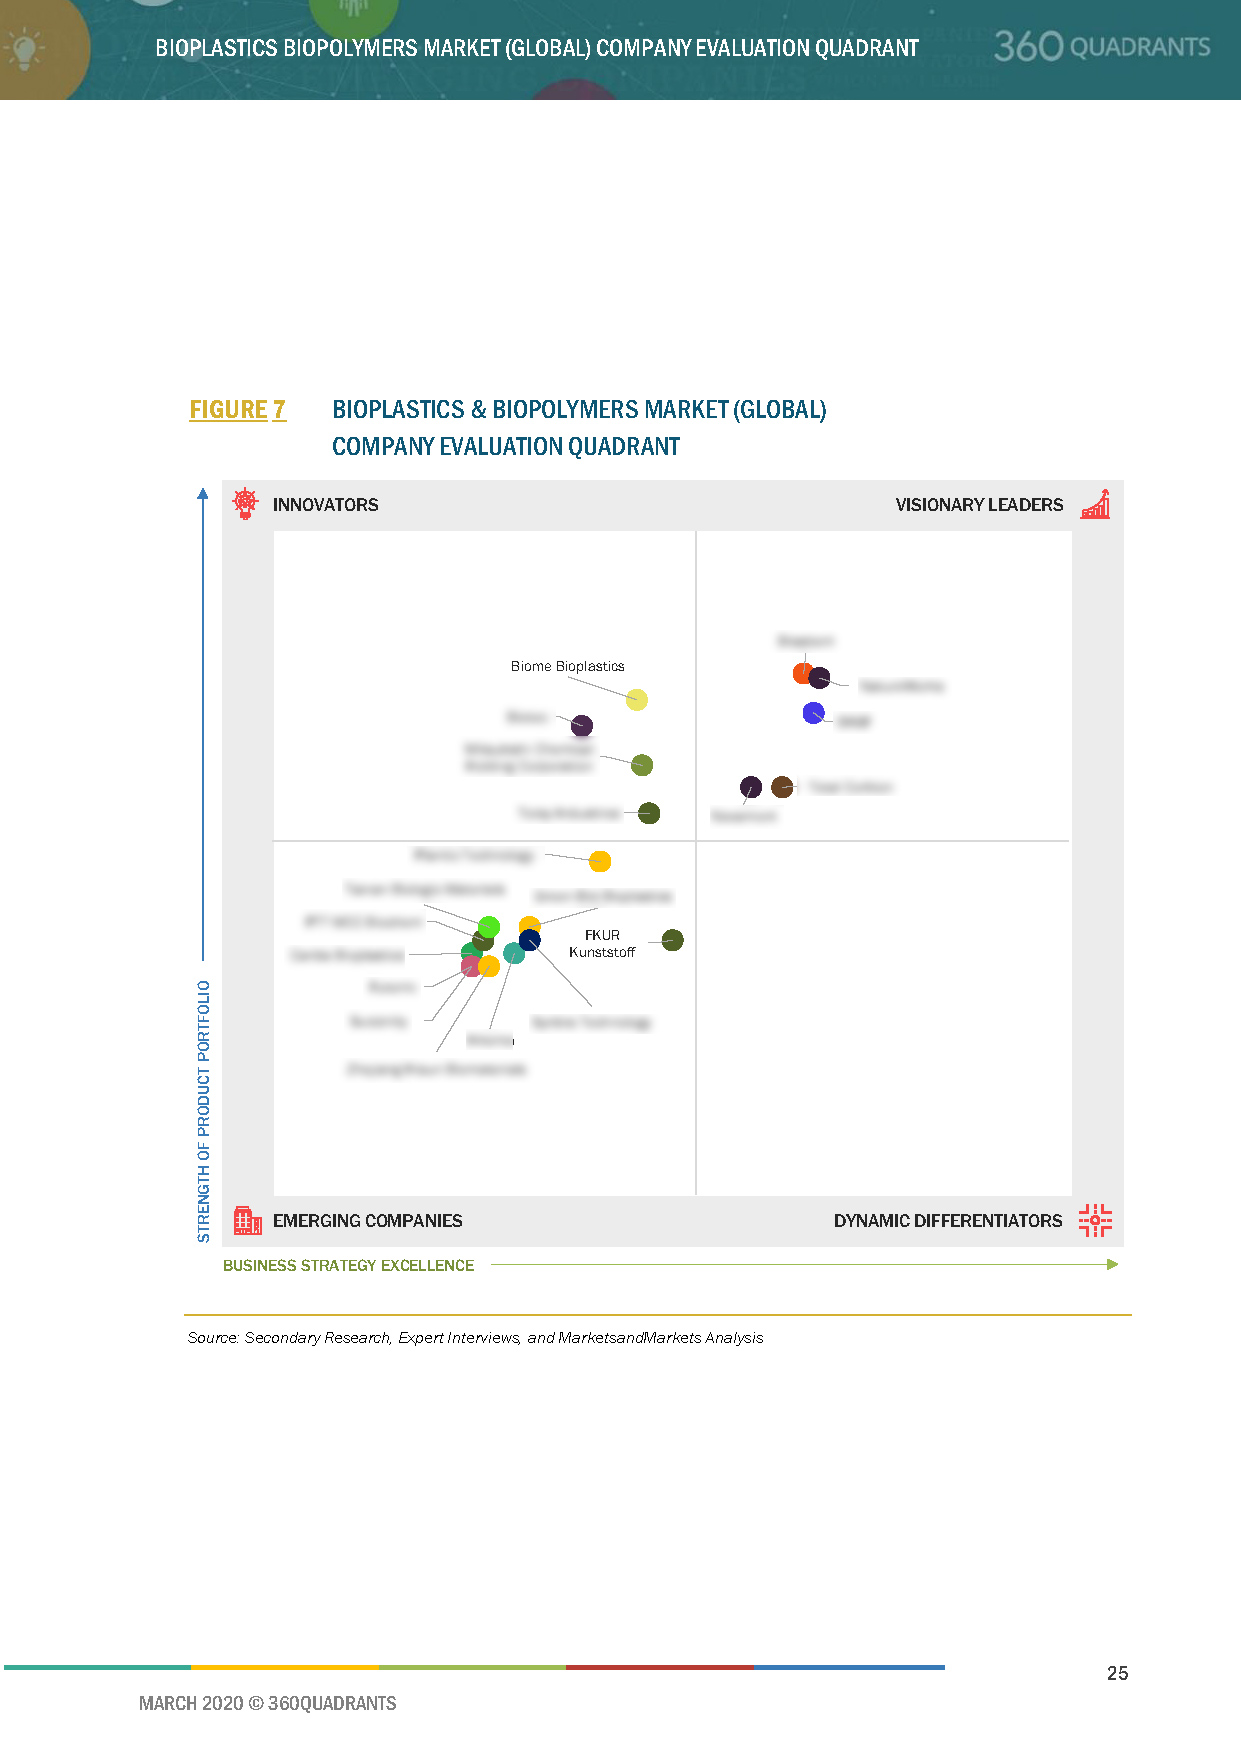
Figure 7 Bioplastics & Biopolymers Market (Global) Company Evaluation Quadrant
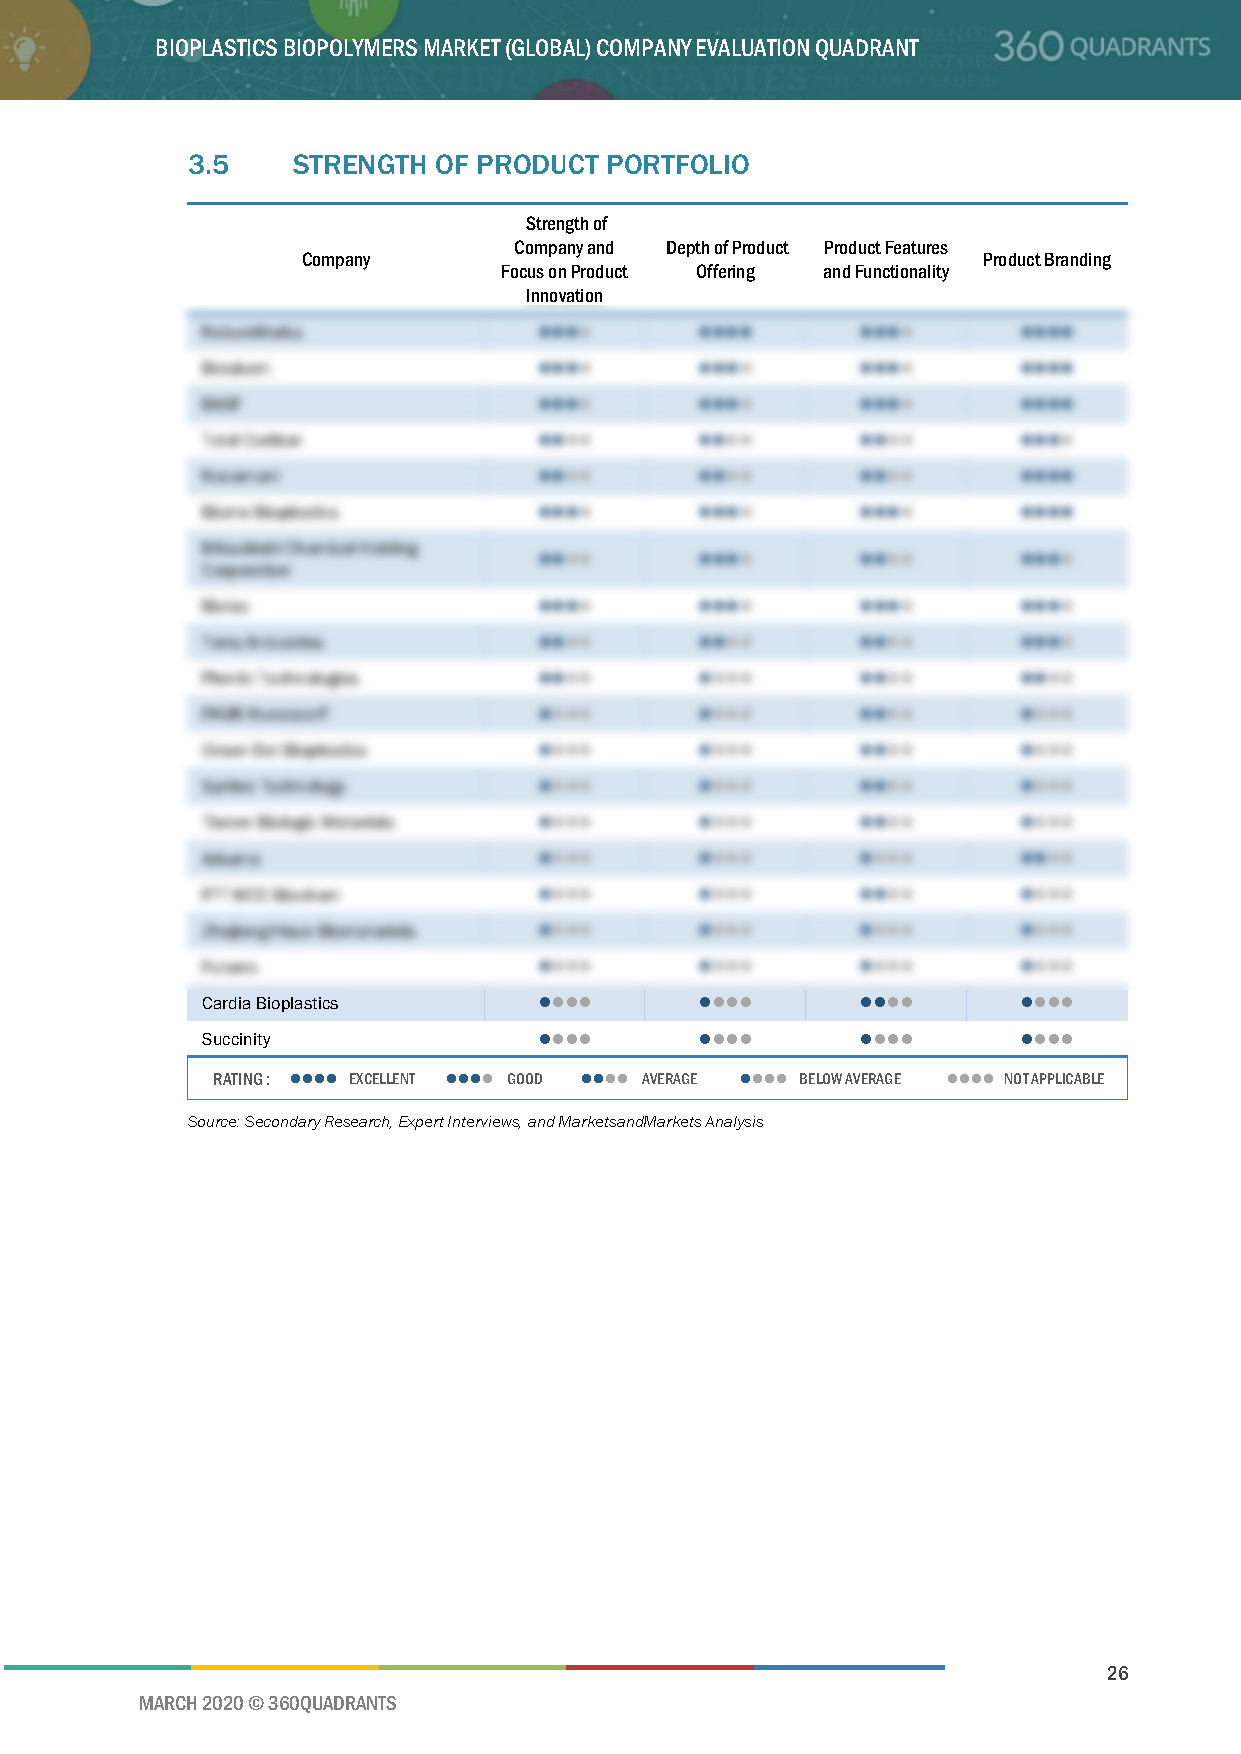
3.5 Strength of Product Portfolio
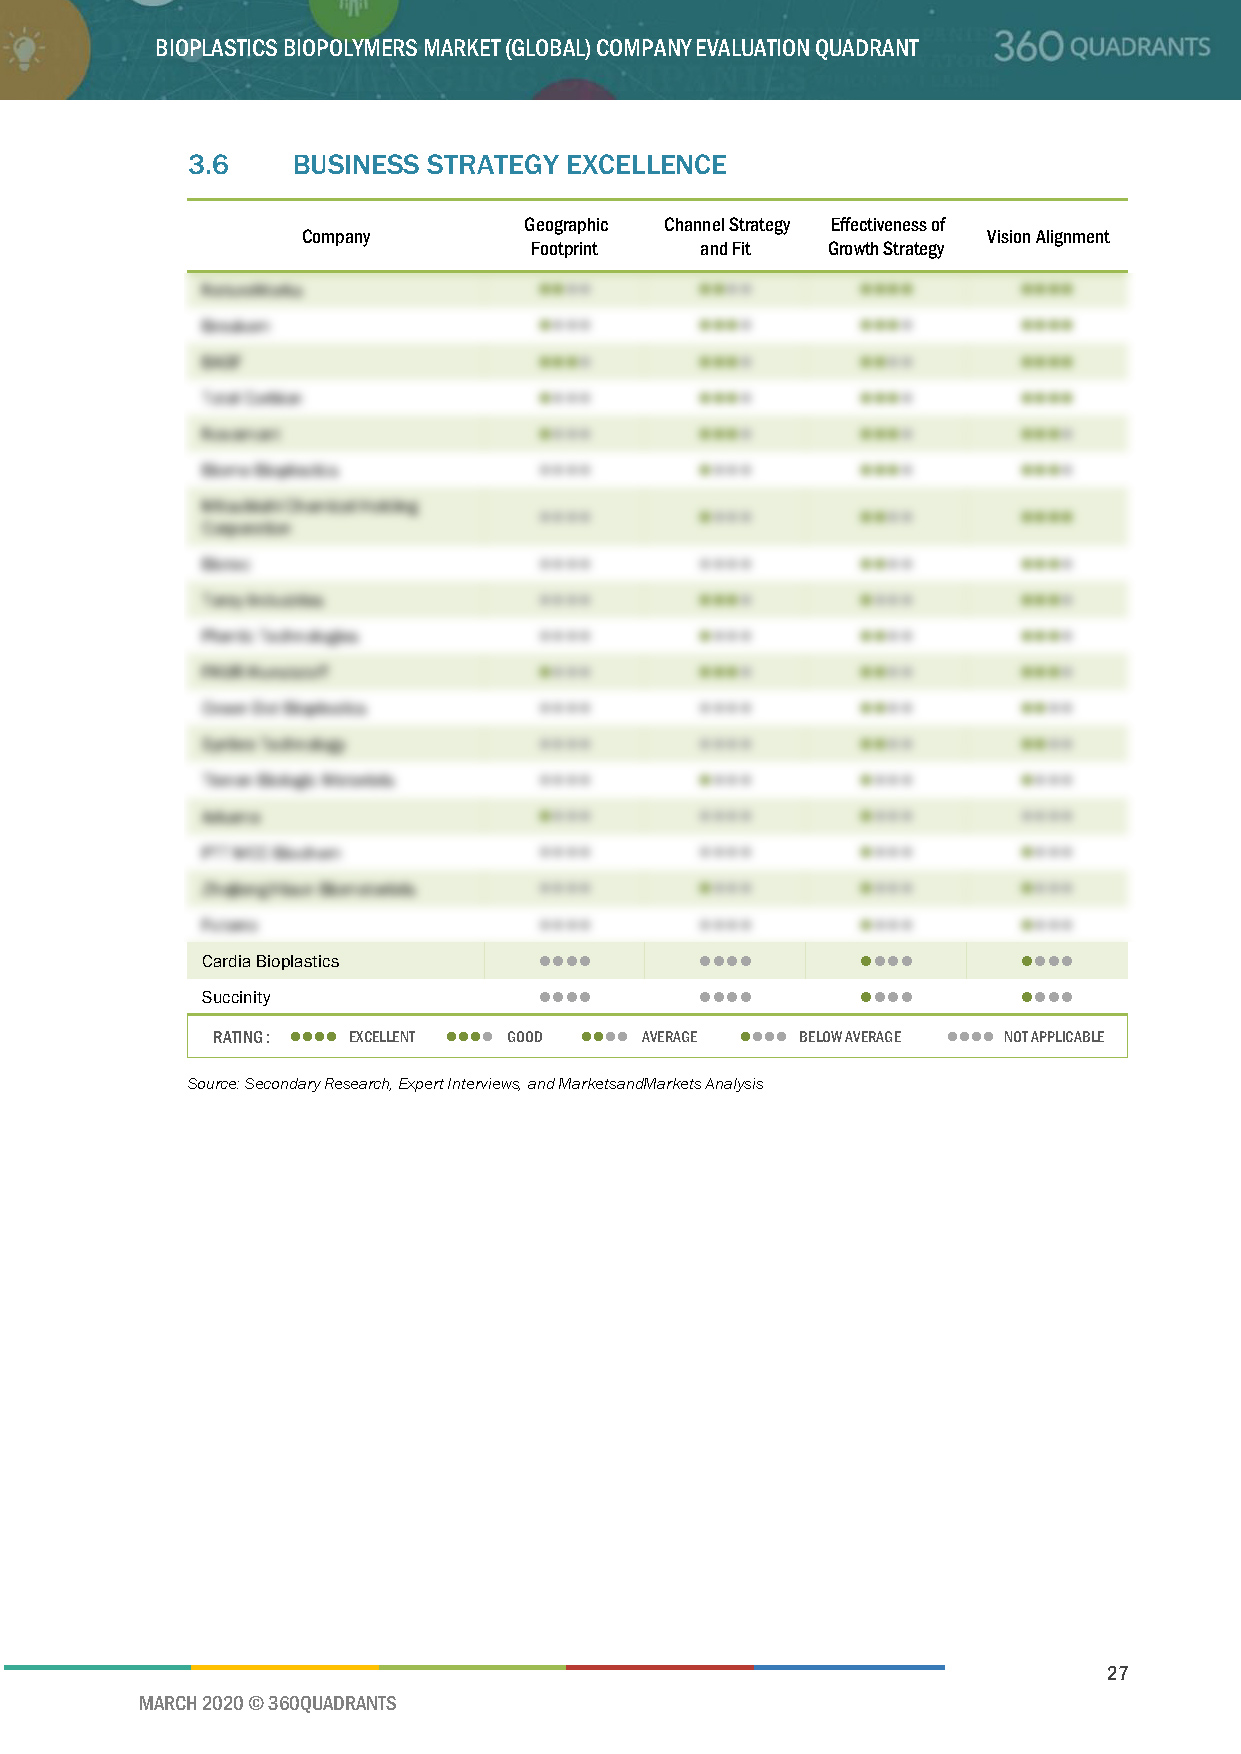
3.6 Business Strategy Excellence
4 Competitive Landscape
4.1 Overview
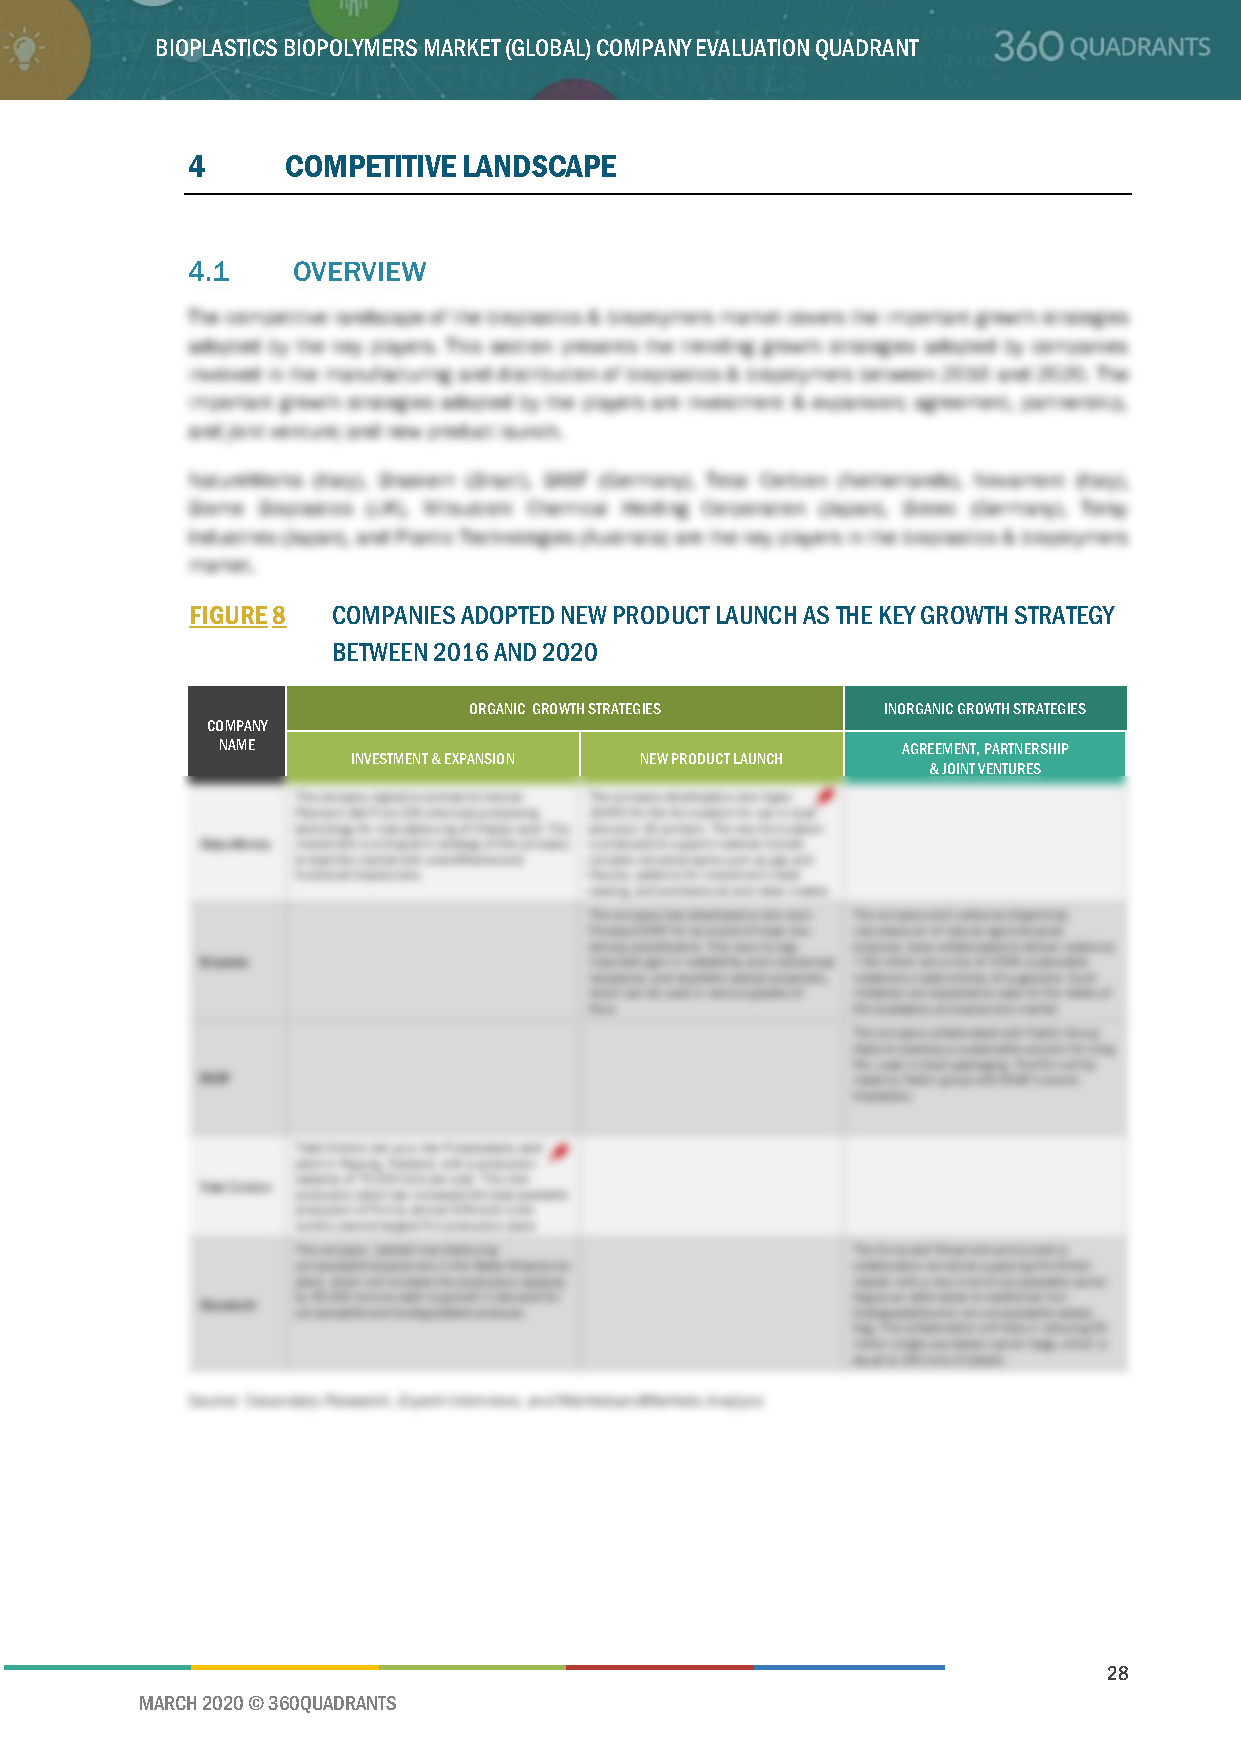
Figure 8 Companies Adopted New Product Launch as the Key Growth Strategy Between 2016 and 2020
4.2 Ranking of Key Players
Figure 9 BASF Catalyst LED the Market in 2019
4.2.1 NatureWorks
4.2.2 Braskem
4.2.3 BASF
4.2.4 Total Corbion
4.2.5 Novamont
4.3 Competitive Scenario
4.3.1 Investment & Expansion
Table 3 Investment & Expansion, 2016–2020
4.3.2 New Product Launch
Table 4 New Product Launch, 2016–2020
4.3.3 Agreement, Partnership, and Joint Venture
Table 5 Agreement, Partnership, and Joint Venture , 2016–2020
5 Company Profiles
5.1 NatureWorks
5.1.1 Business Overview*
5.1.2 Products Offered*
5.1.3 Recent Developments*
5.1.4 SWOT Analysis*
Figure 10 NatureWorks: SWOT Analysis
(*Above sections are present for all of below companies)
5.1.5 Current Focus and Strategies
5.1.6 Threat From Competition
5.1.7 NatureWorks’ Right to Win
5.2 Braskem
Figure 11 Braskem: Company Snapshot
Figure 12 Braskem: SWOT Analysis
5.3 BASF
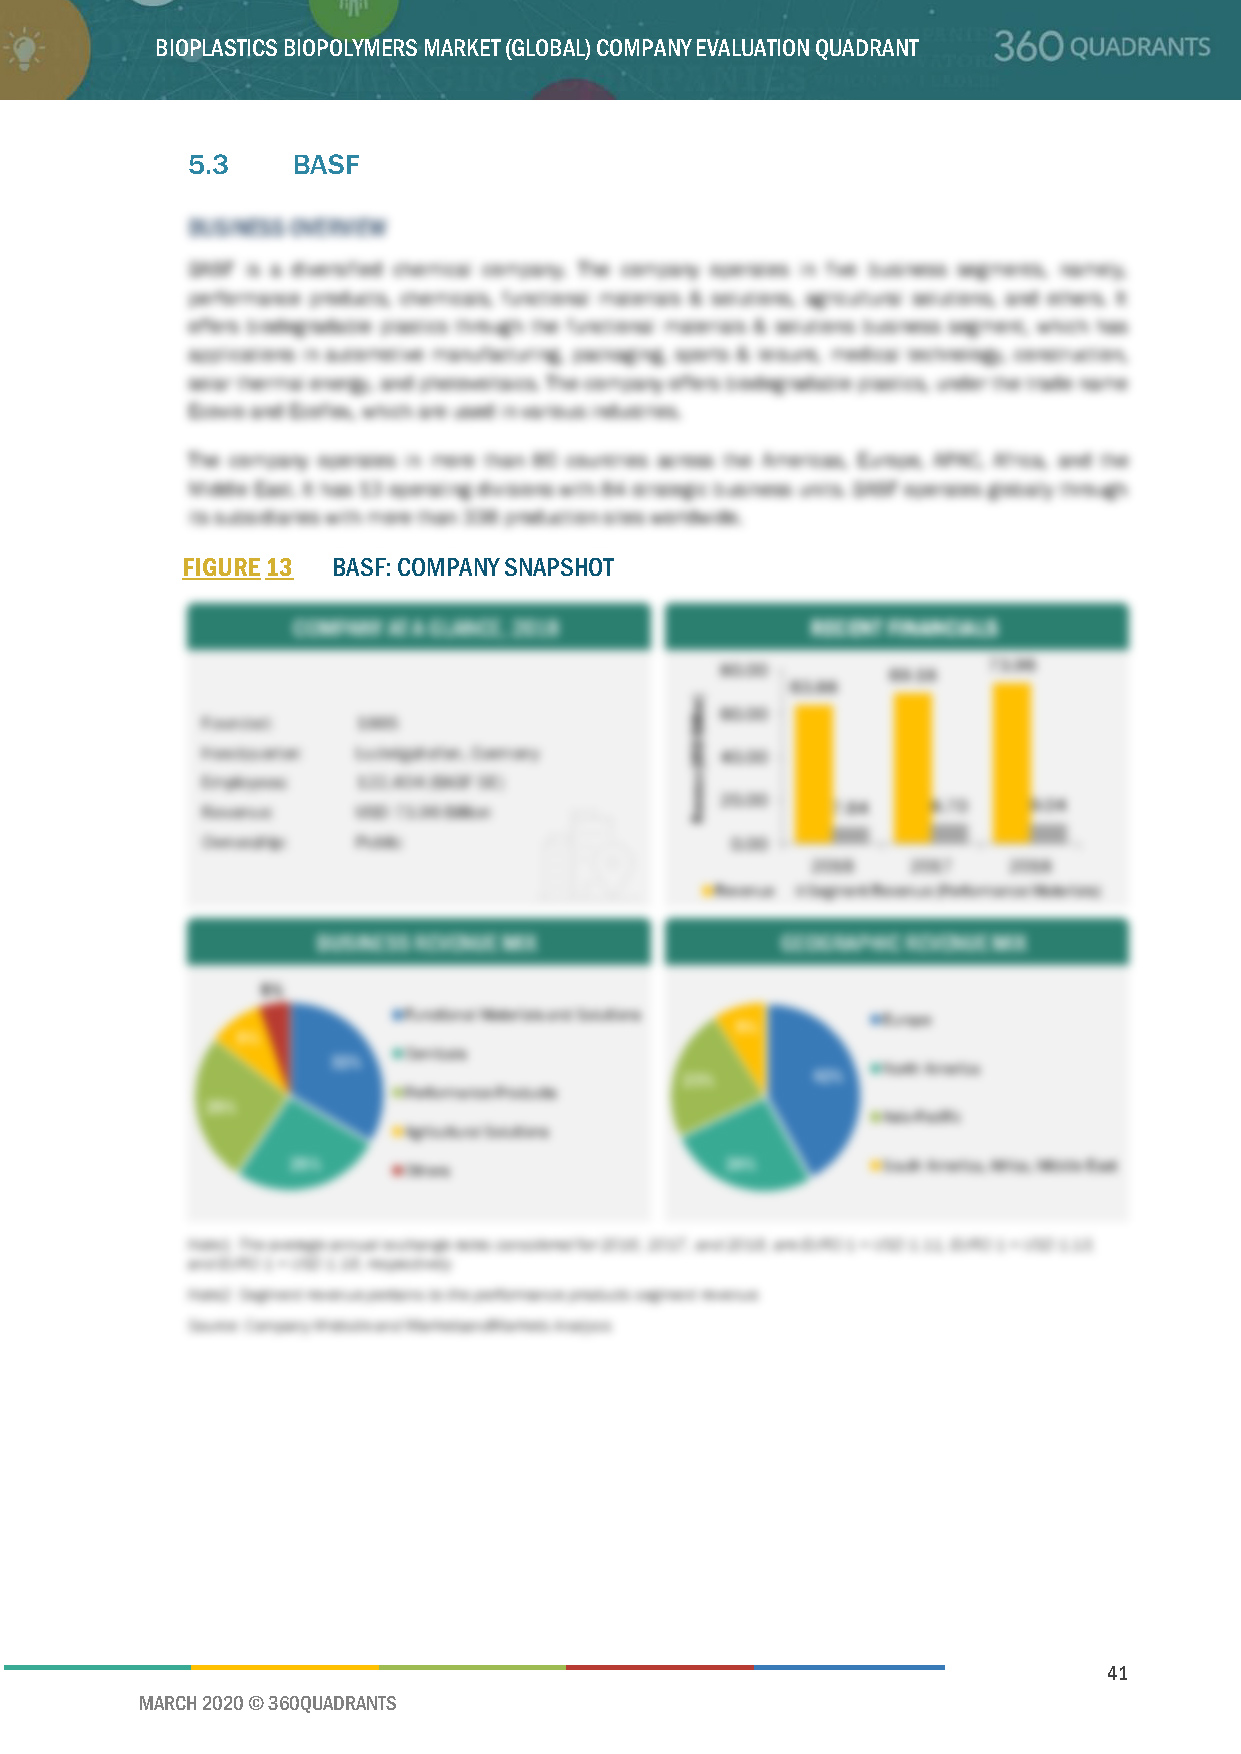
Figure 13 BASF: Company Snapshot
Figure 14 BASF: SWOT Analysis
5.4 Total Corbion
Figure 15 Total Corbion: SWOT Analysis
5.5 Novamont
Figure 16 Novamont: Company Snapshot
Figure 17 Novamont: SWOT Analysis
5.6 Biome Bioplastics
Figure 18 Biome Bioplastics: Company Snapshot
5.7 Mitsubishi Chemical Holdings Corporation
Figure 19 Mitsubishi Chemical Holdings Corporation: Company Snapshot
5.8 BIOTEC
5.9 Toray Industries
Figure 20 Toray Industries: Company Snapshot
5.10 Plantic Technologies
6 Appendix
6.1 Other Significant Players
6.1.1 Arkema
6.1.2 Cardia Bioplastics
6.1.3 Futerro
6.1.4 FKuR Kunststoff
6.1.5 Green Dot Bioplastics
6.1.6 PTT MCC Biochem
6.1.7 Succinity
6.1.8 Synbra Technology
6.1.9 Tianan Biologic Materials
6.1.10 Zhejiang Hisun Biomaterials
6.2 Methodology
This report identifies and benchmarks the key market players in the Bioplastics & Biopolymers market such as BASF (Germany), Biome Bioplastics (UK), Biotec (Germany), Braskem (Brazil), and Mitsubishi Chemicals Holdings Corporation(Japan) and evaluates them on the basis of business strategy excellence and strength of product portfolio within the Bioplastics & Biopolymers market ecosystem, combining inputs from various industry experts, buyers, and vendors, and extensive secondary research including annual reports, company press releases, investor presentations, free and paid company databases. They are rated and positioned on a 2x2 matrix, called as ‘Company Evaluation Quadrant,’ and identified as Visionary Leaders, Dynamic Differentiators, Innovators, or Emerging companies.
SAMPLES:
- Updated version of this Quadrant
- Different Company Evaluation Quadrant
- 'Startup Only' Company Evaluation Quadrant
- Region or Country specific evaluation
- Application or Industry specific evaluation ..Read More
- Submit a Briefing Request
- Question about our published research
- Request for evaluation of your organization for specific market
- Request for re-evaluation of Company Evaluation Quadrant ..Read More
