Biopesticides Quadrant Report
Table of Contents
1 Introduction
1.1 Market Definition
2 Market Overview
2.1 Introduction
2.2 Market Dynamics
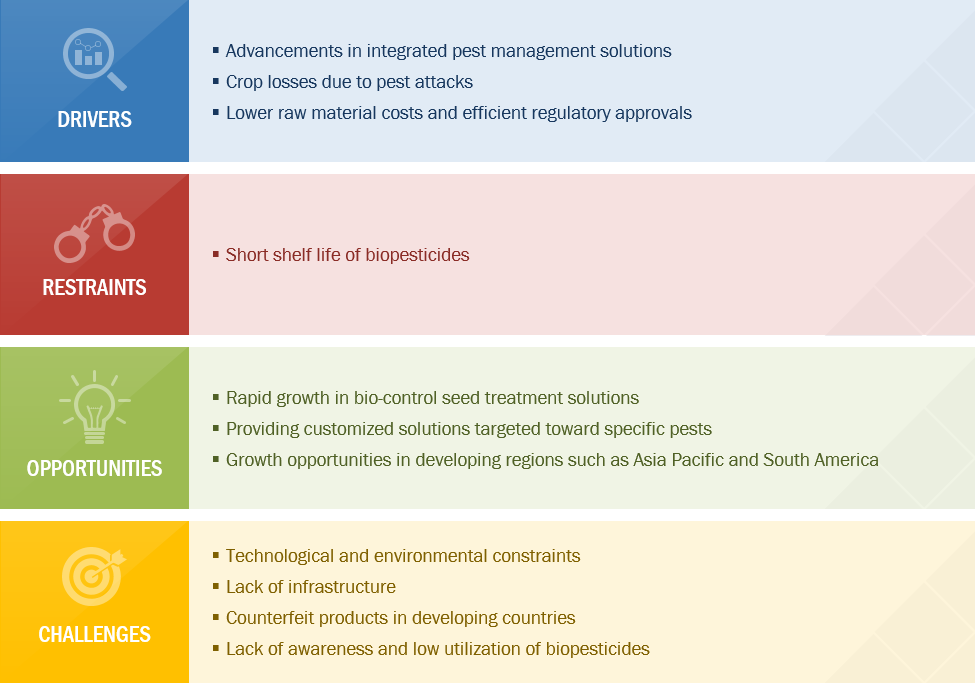
Figure 1 Crop Losses Due to Pest Attacks to Drive the Growth of the Biopesticides Market
2.2.1 Drivers
2.2.1.1 Advancements in Integrated Pest Management Solutions
2.2.1.2 Crop Losses Due to Pest Attacks
Table 1 Larvicidal and Pupicidal Activity of B.Bassiana Against Larvae and Pupa of Mosquito (Cx. Quinquefasciatus)
2.2.1.3 Lower Raw Material Costs and Efficient Regulatory Approvals
2.2.2 Restraints
2.2.2.1 Short Shelf Life of Biopesticides
2.2.3 Opportunities
2.2.3.1 Rapid Growth in Bio-Control Seed Treatment Solutions
2.2.3.2 Providing Customized Solutions Targeted Toward Specific Pests
2.2.3.3 Growth Opportunities in Developing Regions Such as Asia Pacific and South America
Figure 2 Average Pesticide Usage Per Area of Cropland, 2010–2016 (KG/HA)
2.2.4 Challenges
2.2.4.1 Technological and Environmental Constraints
2.2.4.2 Lack of Infrastructure
2.2.4.3 Counterfeit Products in Developing Countries
2.2.4.4 Lack of Awareness and Low Utilization of Biopesticides
2.3 Patent Analysis
Figure 3 Patent Analysis: Biopesticides Market, 2016–2018
Table 2 Recent Patents Granted With Respect to Biopesticides
3 Company Evaluation Quadrant
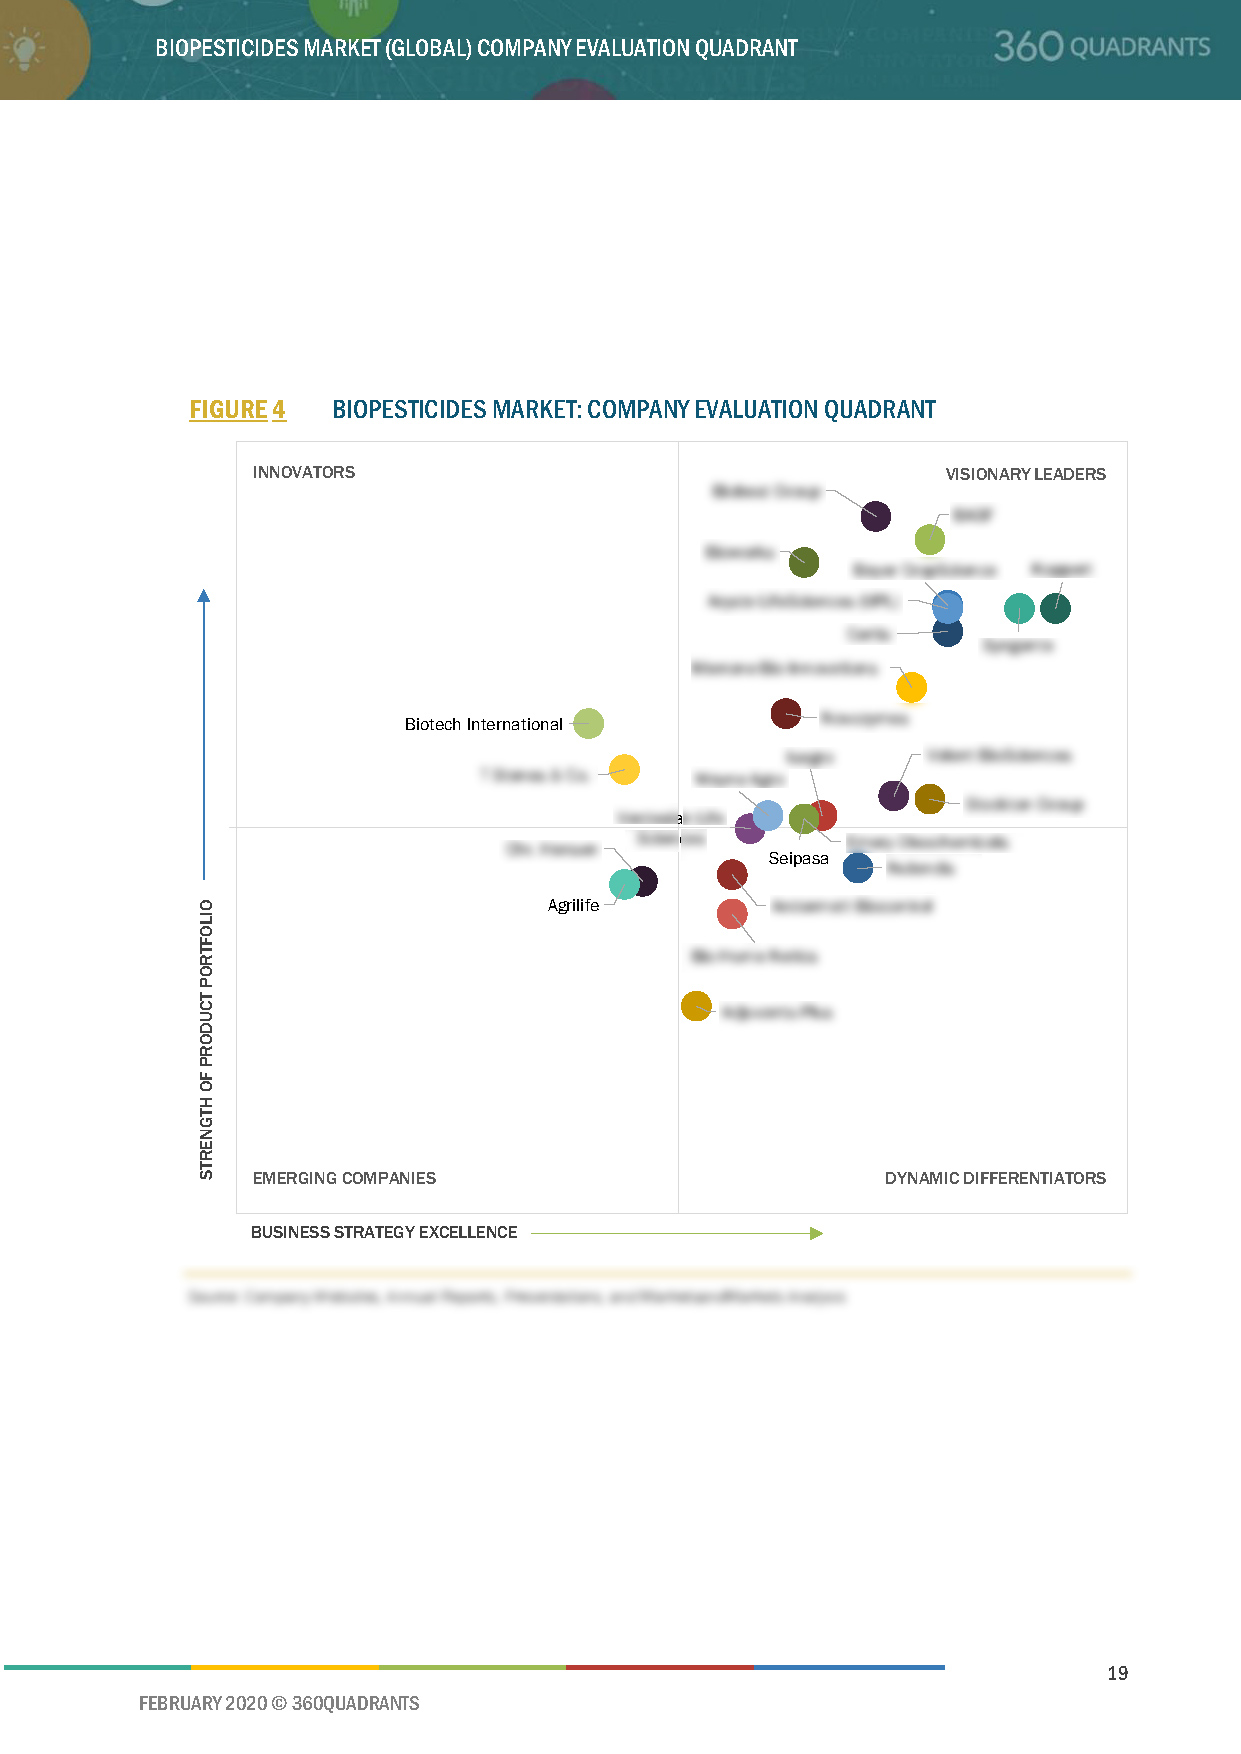
3.1 Visionary Leaders
3.2 Innovators
3.3 Dynamic Differentiators
3.4 Emerging Companies
Figure 4 Biopesticides Market: Company Evaluation Quadrant
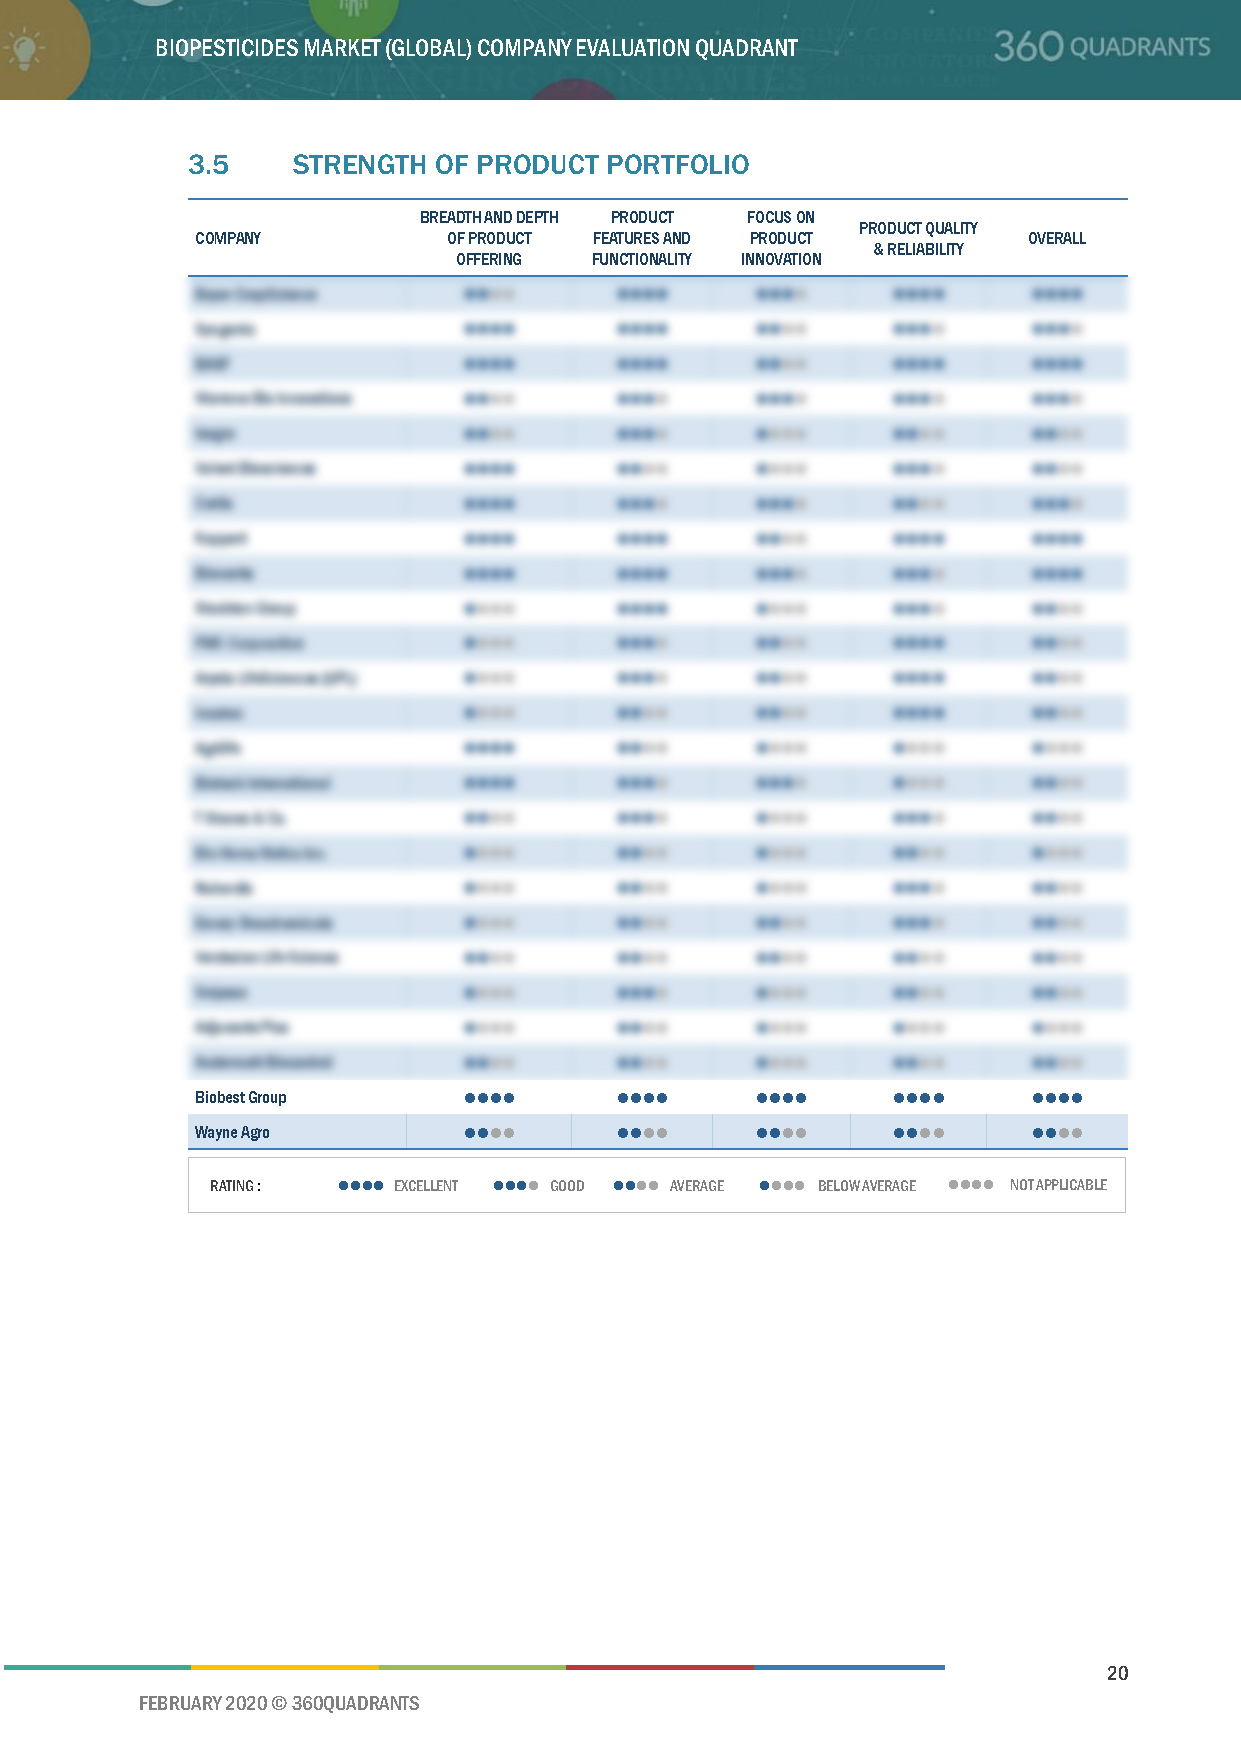
3.5 Strength of Product Portfolio
3.6 Business Strategy Excellence
4 Company Evaluation Quadrant (Start-Up/SME)
4.1 Progressive Companies
4.2 Starting Blocks
4.3 Responsive Companies
4.4 Dynamic Companies
Figure 5 Biopesticides Market: Company Evaluation Quadrant for Startups
4.5 Strength of Product Portfolio
4.6 Business Strategy Excellence
5 Competitive Landscape
5.1 Overview
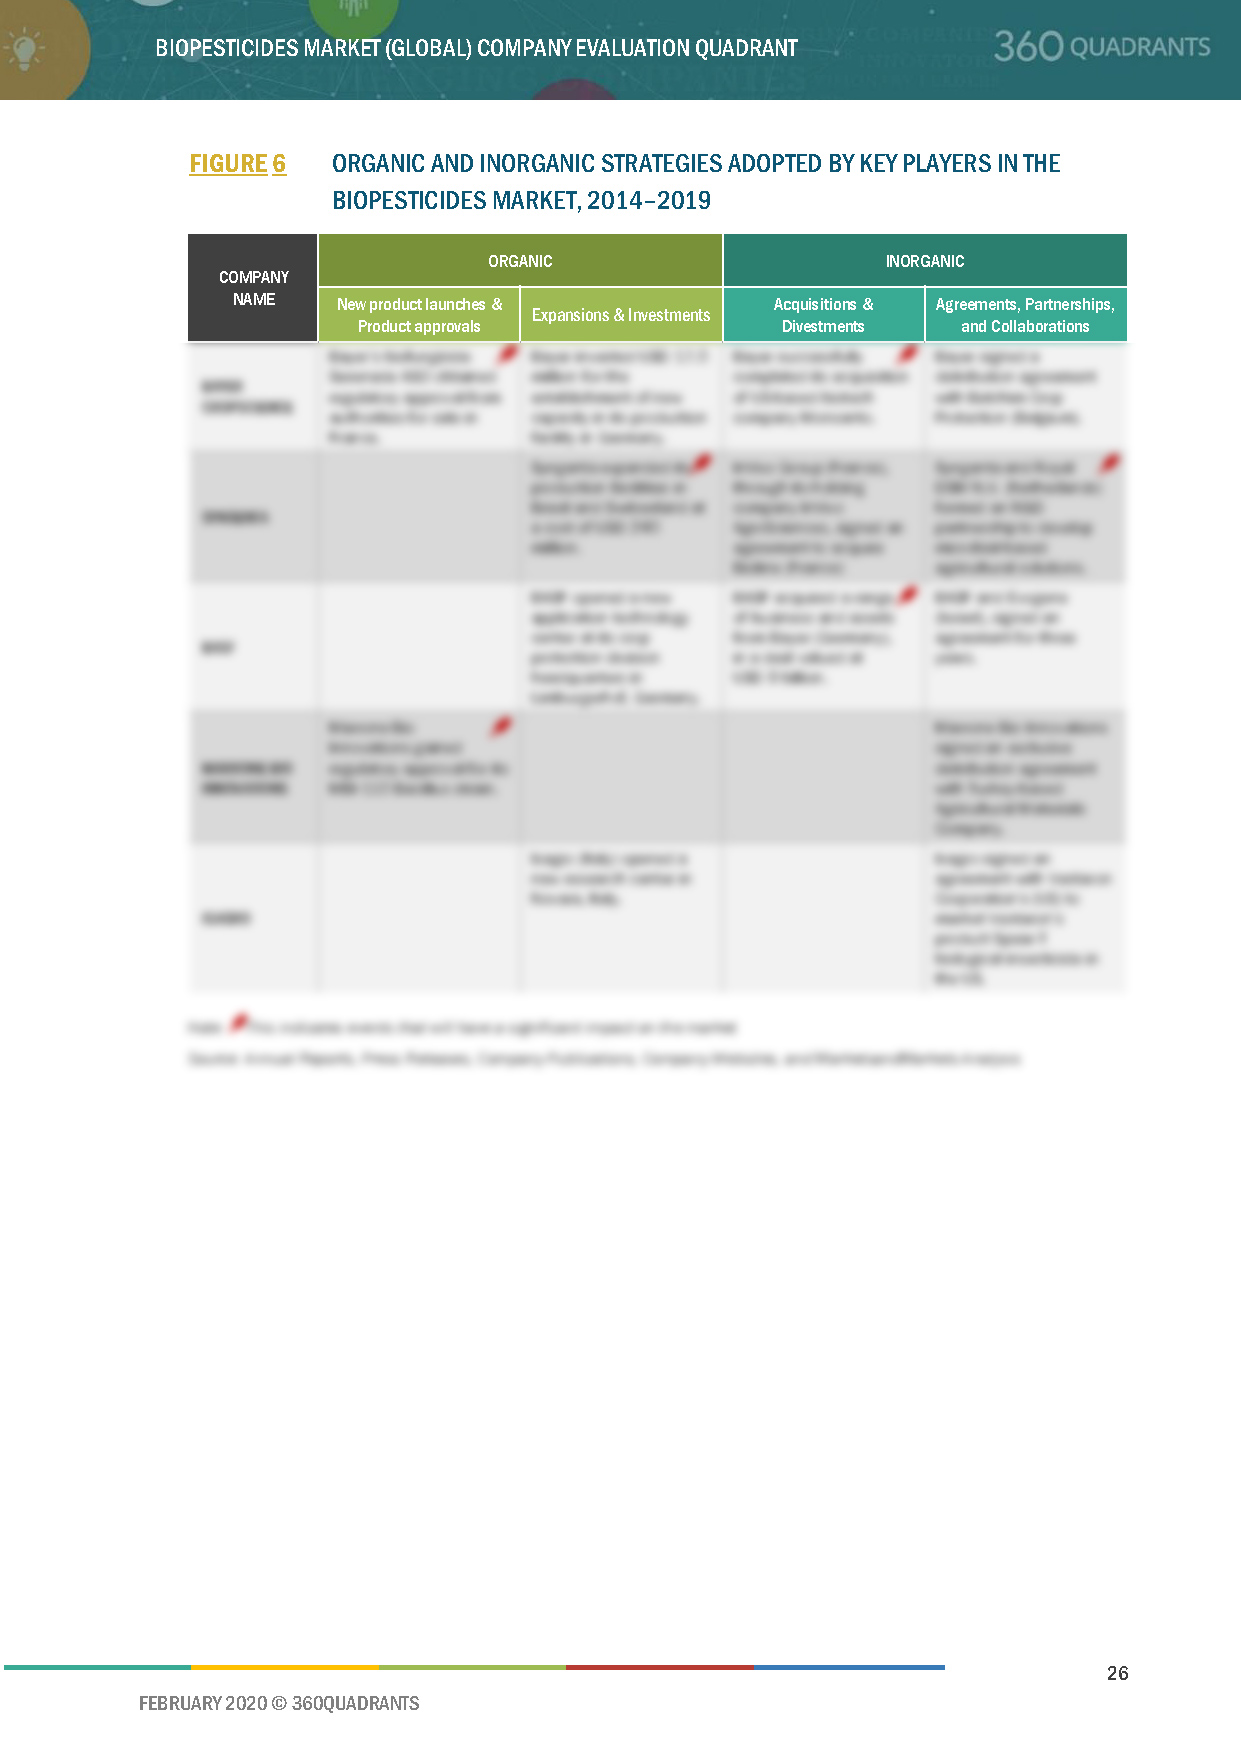
Figure 6 Organic and Inorganic Strategies Adopted By Key Players in the Biopesticides Market, 2014–2019
5.2 Company Share Analysis
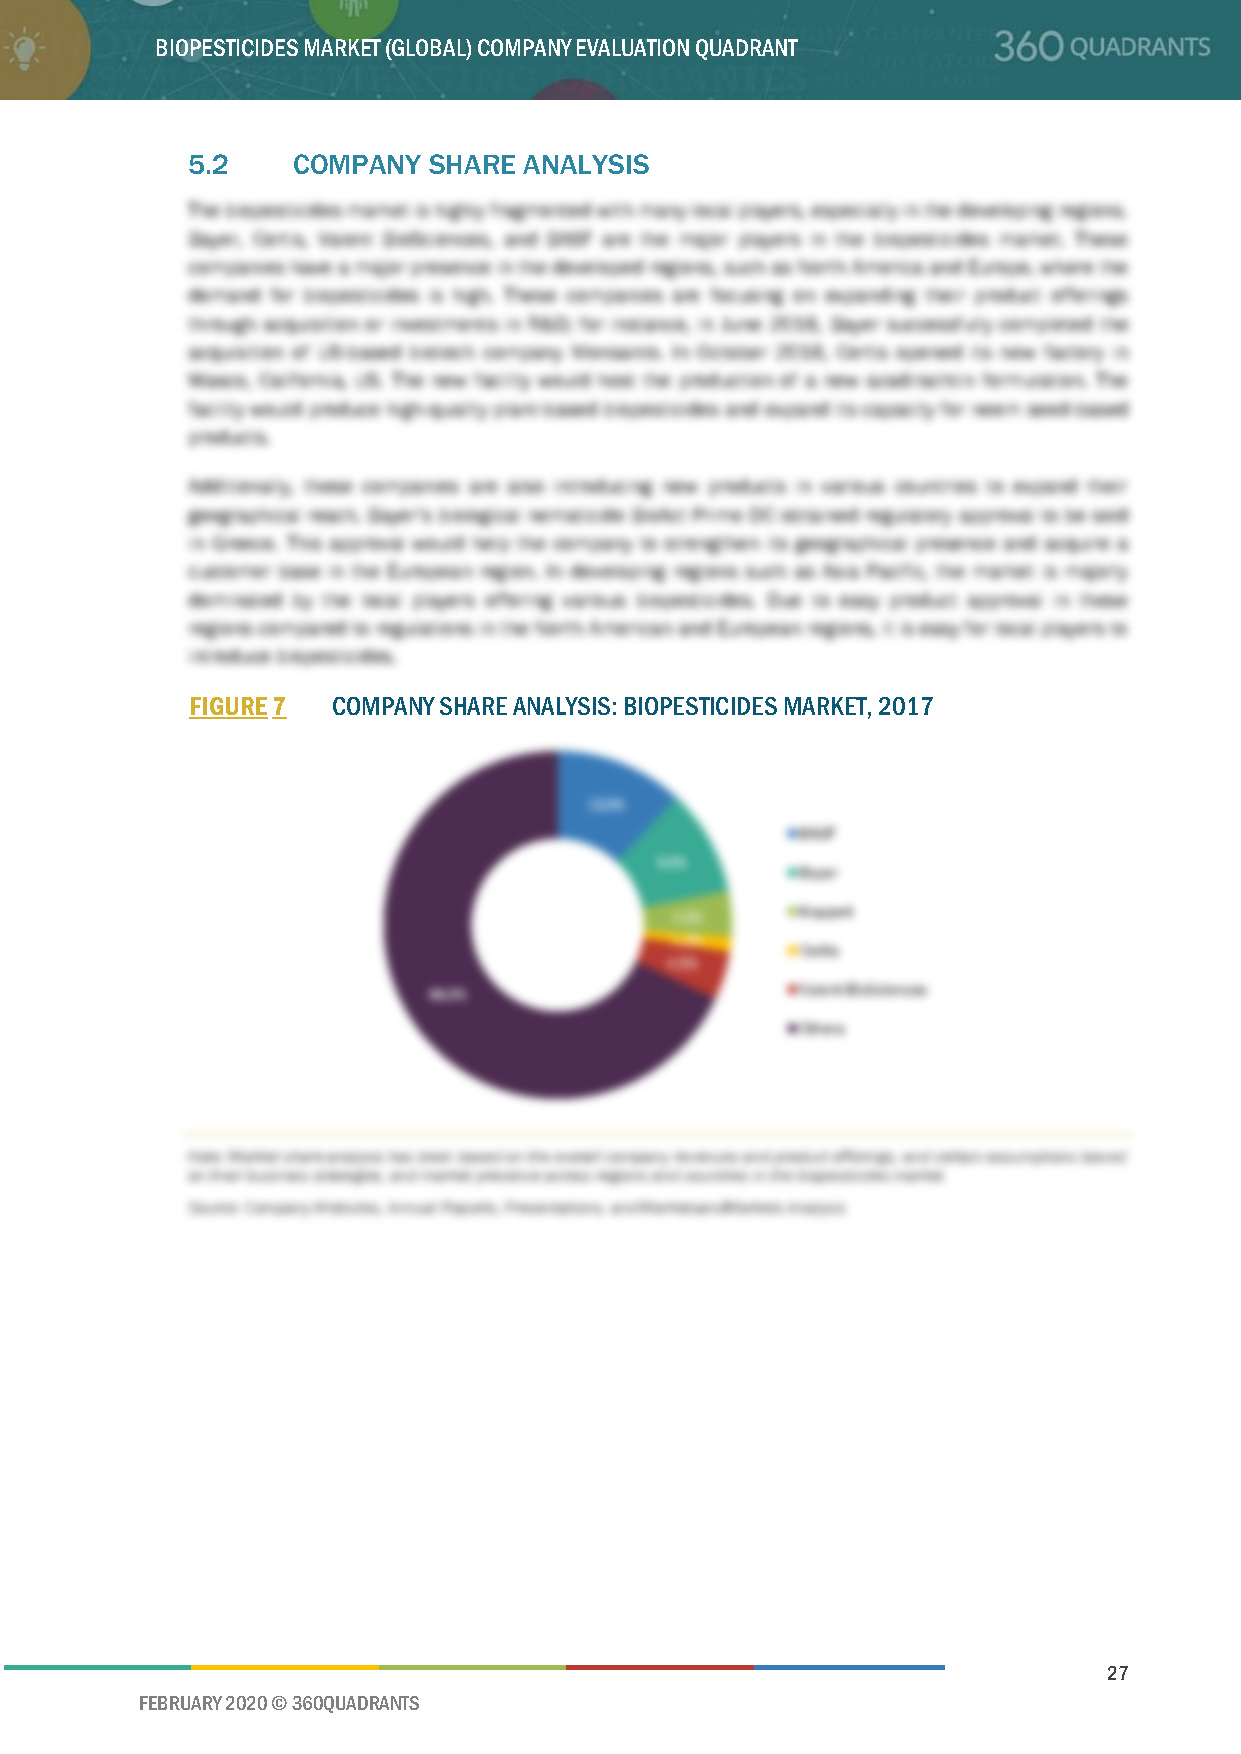
Figure 7 Company Share Analysis: Biopesticides Market, 2017
5.3 Competitive Scenario
5.3.1 New Product Launches and Approvals
Table 3 New Product Launches and Approvals, 2014–2019
5.3.2 Expansions & Investments
Table 4 Expansions & Investments, 2014-2018
5.3.3 Acquisitions and Divestments
Table 5 Acquisitions & Divestments, 2014-2019
5.3.4 Agreements, Collaborations,and Partnerships
Table 6 Agreements, Collaborations, Partnerships, and Mergers, 2014–2018
6 Company Profiles
6.1 Bayer Cropscience
6.1.1 Business Overview*
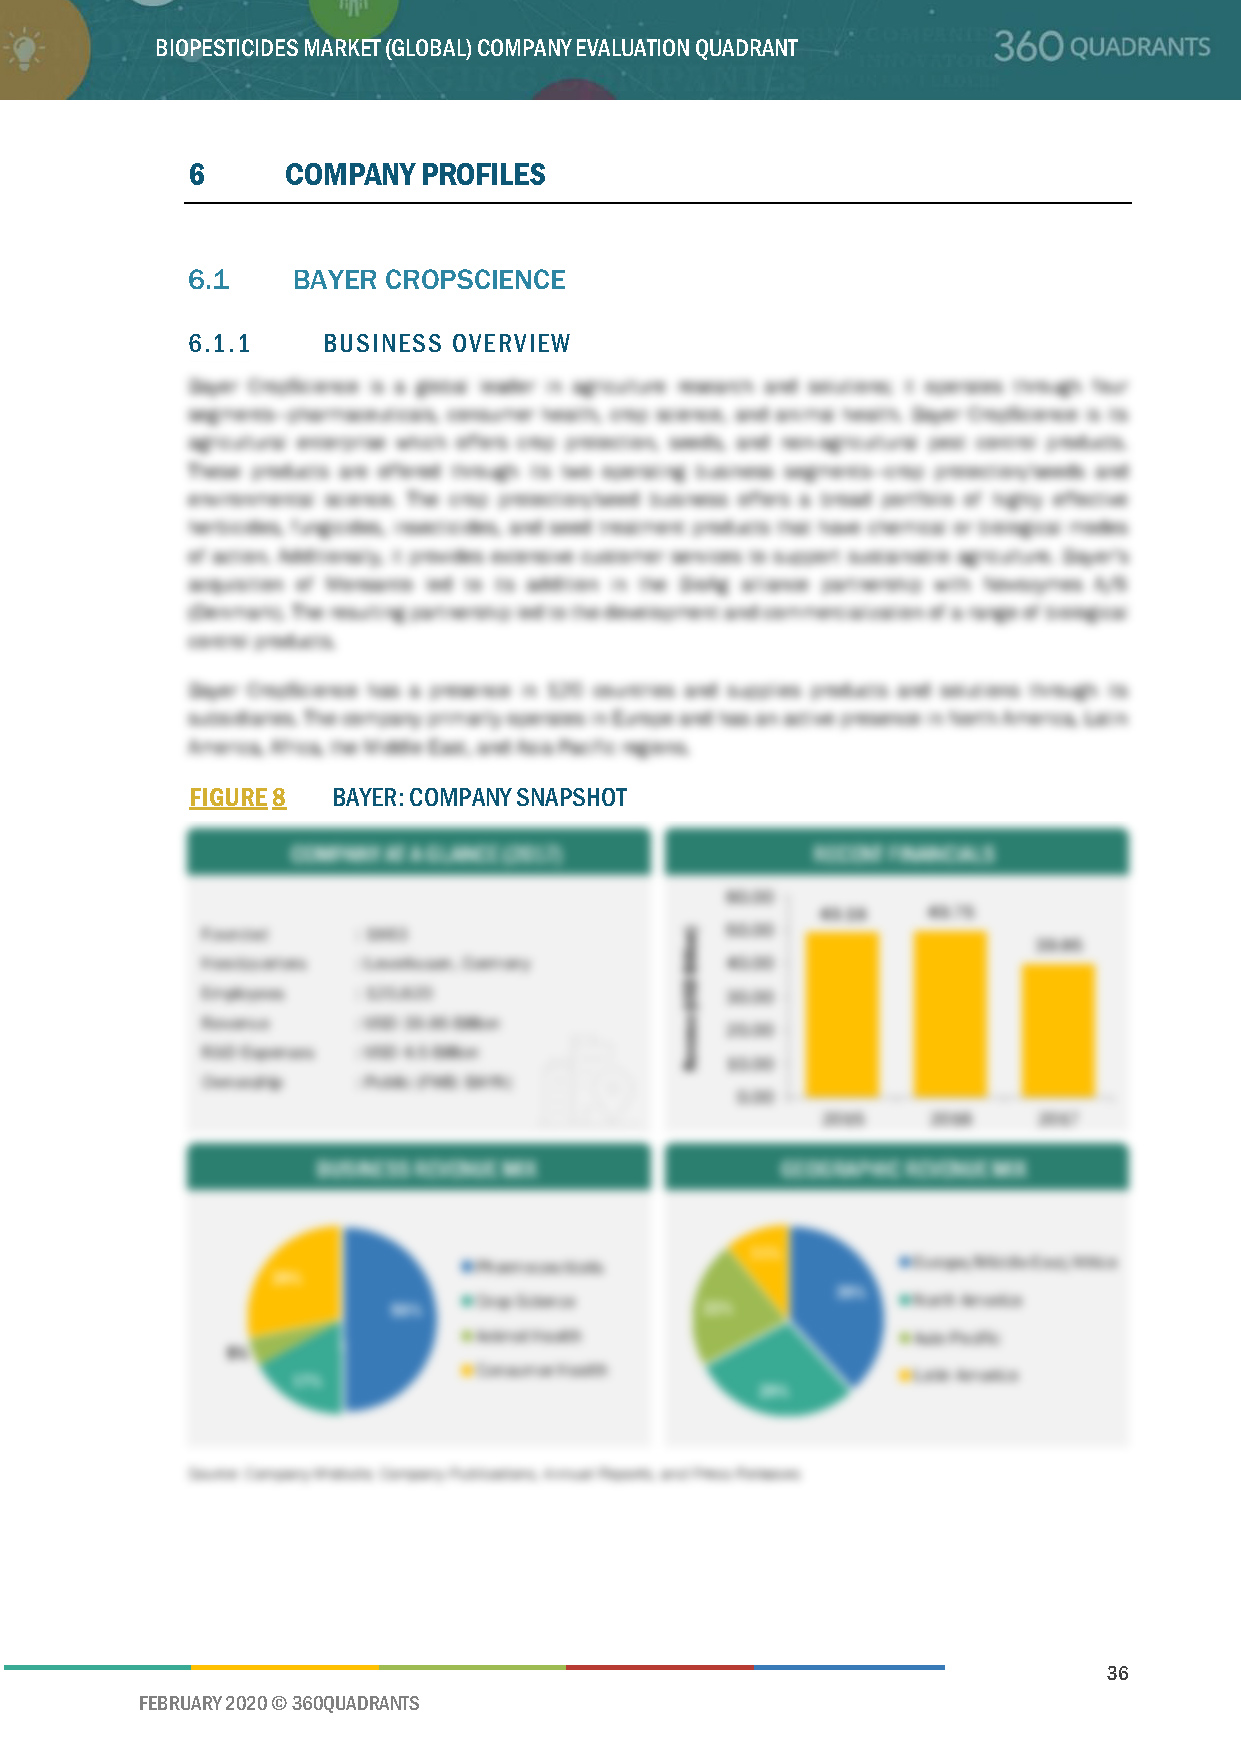
Figure 8 Bayer: Company Snapshot
6.1.2 Products Offered: Bayer Cropscience*
6.1.3 Products Offered: Monsanto BioAg*
6.1.4 Recent Developments*
6.1.5 SWOT Analysis*
Figure 9 Bayer Cropscience: SWOT Analysis
6.1.6 MnM View*
(*Above sections are present for all of below companies)
6.2 BASF
Figure 10 BASF: Company Snapshot
Figure 11 BASF: SWOT Analysis
6.3 Syngenta AG
Figure 12 Syngenta: Company Snapshot
Figure 13 Syngenta: SWOT Analysis
6.4 UPL Ltd.
Figure 14 UPL: Company Snapshot
6.5 FMC Corporation
Figure 15 FMC Corporation: Company Snapshot
6.6 Isagro
Figure 16 Isagro: Company Snapshot
Figure 17 Isagro: SWOT Analysis
6.7 Valent Biosciences
6.8 Certis
6.9 Koppert B.V.
6.10 BioWorks
6.11 Stockton Group
6.12 Marrone Bio Innovations
Figure 18 Marrone Bio Innovations: Company Snapshot
Figure 19 Marrone Bio Innovations: SWOT Analysis
7 Appendix
7.1 Methodology
This report identifies and benchmarks best Biopesticide manufacturers such as BASF SE, BAYER AG, SYNGENTA AG, UPL LIMITED, FMC CORPORATION, and MARRONE BIO INNOVATIONS, and evaluates them on the basis of business strategy excellence and strength of product portfolio within the Biopesticides market ecosystem, combining inputs from various industry experts, buyers, and vendors, and extensive secondary research including annual reports, company press releases, investor presentations, free and paid company databases of best Biopesticide manufacturers. They are rated and positioned on 2x2 matrix, called as ‘Company Evaluation Quadrant’, and identified as Visionary Leaders (top companies), Dynamic Differentiators, Innovators, or Emerging companies.
SAMPLES:
- Updated version of this Quadrant
- Different Company Evaluation Quadrant
- 'Startup Only' Company Evaluation Quadrant
- Region or Country specific evaluation
- Application or Industry specific evaluation ..Read More
- Submit a Briefing Request
- Question about our published research
- Request for evaluation of your organization for specific market
- Request for re-evaluation of Company Evaluation Quadrant ..Read More
